SUMMARY: Part One: There are two separate areas of the insula. One is involved with generalized sensory magnitude integration, and the other is specialized in evaluating nociceptive stimulus properties including a weaker estimation of magnitude.
Student: And what is giving you such a puzzled look?
Professor: I am confused! Some experts have highly criticized one of my favorite research studies.
- In a recent blog post, I wrote about an apparently well designed study by Baliki et al. (2009) demonstrating that the insula was highly involved in dyspnea magnitude estimation (click to see post).
- But even more recently I found a review in which Moayedi & Weissman-Fogel (2009) meticulously critiqued the methods, results, and conclusions of the Baliki et al study.
METHODS AND RESULTS FROM BALIKI ET AL. (2009)
Professor: To be fair to Baliki et al. and Moayedi & Weissman-Fogel, this post will be in two parts, and the parts are detailed. Let’s begin with the design that Baliki et al. actually used in their study:
- Using a finger-span device, the subjects rated thermal pain during an fMRI scan.
- The investigators created lines on slides having lengths identical to each of the subjects’ thermal ratings.
- During a subsequent scan, the subjects rated these lines as they varied in length, i.e., made visual ratings, which unbeknownst to them were the same values as their heat pain ratings.
- To determine how much magnitude variability there was in each participant’s ratings, they
calculated the variance both for their pain ratings and for their visual length ratings.
Student: Please show Part A of their Figure 1 and its original legend from the article by Baliki et al. (2009):
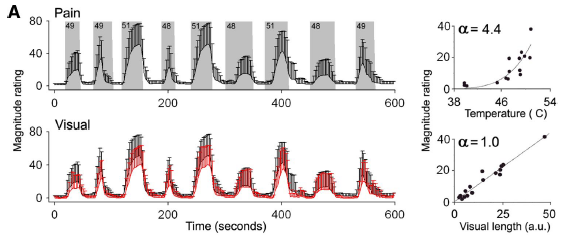
“FIG. 1. Brain activity maps for pain- and visual-rating tasks.
- “A, top: average pain ratings for painful heat. Gray areas delineate epochs and [show] intensities (in degrees Celsius for the thermal stimuli).
- “Bottom”[A,] bottom: average [ratings] for the visual task.
- “The black trace is the visual stimulus, obtained from the subject’s pain ratings.
- “The red trace corresponds to the subject’s rating (bars are [for standard deviations (SD)]).
- “Scatterplots show the relationship between stimulus intensity and perceived magnitudes and follows a power function with exponent of 4.4 for pain and 0 for visual ratings.” (page 876) [emphasis added]
Student: It is really easy to see the rather large group SDs for the pain-ratings and for the visual-ratings for each sample time.
Professor: Since variance is critical to this discussion, the following are definitions of both standard deviation and variance:
- “The Standard Deviation [(SD)] is a measure of how spread out numbers are. The formula is easy: it is the square root of the Variance. So now you ask, “What is the Variance?”
- “The Variance is defined as: The average of the squared differences from the Mean.”
- Source: http://www.mathsisfun.com/data/standard-deviation.html
Professor: Therefore,
- in Figure 1, left, notice that the vertical red bars really represent the rather large SD for all the ratings for the group at each sample time, and
- in Figure 1, right, notice that the scatterplots provide excellent examples of psychophysical scaling that is clearly described by Gunnar Borg (pages 18-28, 1998).
Student: And I hope it’s time to see the analyses; if so, please show Parts C and D for their Figure 3 and its original legend:
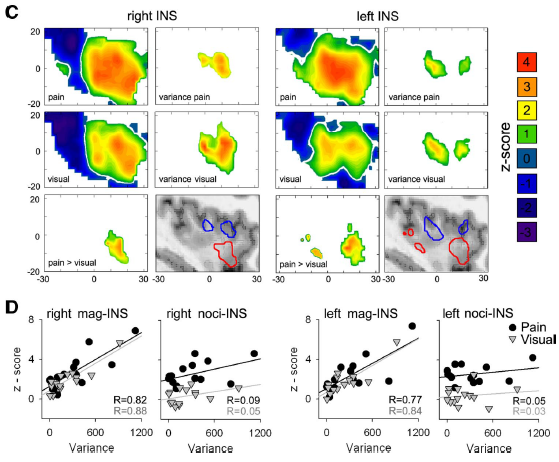
“FIG. 3. Brain regions encoding variance of pain- and visual-rating tasks.
- “C: topological maps for insular activity and variance encoding in pain- and visual-rating tasks. Bottom right panels show spatial dissociation for pain-specific activation [areas (regions that are] significantly more active during pain than the visual-rating task, nociceptive-specific [noci-INS], red contour) and magnitude encoding areas (regions that are commonly activated and equally encode magnitudes during pain- and visual-rating tasks, magnitude- related [mag-INS], blue contour).
- “D: scatterplots depict the relationship between brain activity from mag-INS and noci-INS (mean z-score) and variance for pain (circle) and visual (triangle) tasks.” (page 878) [insertions and emphasis added]
Professor: First notice that in the legend, Baliki et al. have used special abbreviations:
- mag-INS was the abbreviation they gave to the specific areas of the insula identified in their conjunction analysis for stimulus magnitude; likewise
- noci-INS was their abbreviation for different areas of the insula identified in their contrast analysis to be specific for pain only.
Professor: Then note that the investigators followed these steps when analyzing their data:
- First, they examined the effect of tasks on fMRI activity by using a
- covariation analysis separately for distinct pain or visual regions,
- conjunction analysis with combined pain and visual data for common regions, and
- pain greater than visual activity analysis for regions specific for pain.
- Second, they looked at the effect of ratings variance within participants upon variance of active regions during their scan with a
- covariation analysis separately for pain or visual task rating variances to identify corresponding fMRI activity regions,
- conjunction analysis with combined pain and visual rating variances to detect common regions, and
- pain greater than visual activity analysis for regions specific for pain rating variance.
- Last, they drafted scatterplots that showed pain or visual rating variances were HIGHLY associated with bilateral z-scores for mag-INS regions and NOT associated with bilateral z-scores for noci-INS regions.
Professor: Also note the locations of the areas associated with group variances for pain- and visual-ratings.
Student: Hmm. It is difficult to determine if the activity of insular cortex is anterior or middle for pain-variance and for visual-variance.
Professor: Looks to me as if
- the mag-INS regions are up in the dorsal insula and
- the noci-INS regions are down in ventral insula.
Student: What did Moayedi & Weissman-Fogel write about these results?
INTRODUCTORY PARAGRAPH FROM MOAYEDI AND WEISSMAN–FOGEL (2009)
Professor: The start of the review by Moayedi & Weissman-Fogel begins like this:
- “In a recent article … Baliki and colleagues adopted an innovative approach to search for a magnitude estimator (magINS) in the brain.
- “Toward this goal, the authors used functional magnetic resonance imaging (fMRI) to examine brain responses to a visual task and to painful stimuli.
- “Herein lies the piéce de résistance of the article:
- the psychophysics used in the article relies on the postulation that the amount of information perceived—in this case visual magnitude and pain intensity—is equivalent to the variance of the stimulus magnitude ratings.
- The authors state that a functional network that correlates to both the variance and the ratings of a given stimulus would represent a magnitude estimator of stimulus modality. …
- “Their findings contribute to two different and ongoing debates among pain scientists:
- the first is the issue of whether there is a specific region of the brain that is responsible for intensity coding of pain and
- the second is the more hotly debated issue of the role of the insula in pain perception.
- “Here, we present some of the key concepts for each of these debates and discuss how the central magnitude perception regions presented by Baliki and colleagues correspond with these other ideas.” (page 1345) [emphasis added]
Student: Please say more about the experimental importance of “the variance of the stimulus magnitude ratings,” as the critics wrote.
Professor: Actually the critics stated, “… the postulation that the amount of information perceived—in this case visual magnitude and pain intensity—is equivalent to the variance of the stimulus magnitude ratings.”
Student: Did they really mean “is equivalent to” in a literal sense?
Professor: Well, I don’t know. What Baliki et al. wanted to do was separate the ‘network’ related to specifically acknowledging pain from the ‘network’ related to rating the magnitude for pain stimuli or for visual stimuli
- “… along the dimension of the amount of information transmitted by each subject’s ratings, as defined by Shannon and Weaver (1949).
- “Classical psychophysical studies show that, within a given system, the amount of information is directly related to the variance of the performance (see Miller 1956).
- “Therefore in this study, the amount of information perceived (and transmitted to the observer) during the pain and visual tasks was explored by the variance of the subjective ratings. (page 881)” [emphasis added]
Professor: And the following is quoted from what Miller (1956) actually wrote:
- “If it is a good communication system, however, there must be some systematic relation between what goes in and what comes out.
- “That is to say, the output will depend upon the input, or will be correlated with the input.
- “If we measure this correlation, then we can say how much of the output variance is attributable to the input and how much is due to random fluctuations or “noise” introduced by the system during transmission.
- “So we see that the measure of transmitted information is simply a measure of the input-output correlation.” (page 82) [emphasis added]
Professor: Then in his next paragraph, Miller strongly stated,
- “There are two simple rules to follow.
- “Whenever I refer to ‘amount of information,’ you will understand ‘variance.’
- “And whenever I refer to ‘amount of transmitted information,’ you will understand ‘covariance’ or ‘correlation.’“ (page 82) [reformatting and emphases added]
Student: Then the critics could have said “is directly related to” instead of “is equivalent to.” That distinction seems like more than just simple semantics!
Professor: Exactly! Now let me allow Baliki et al. to summarize their own results beginning with their Figure 4 and its original legend:
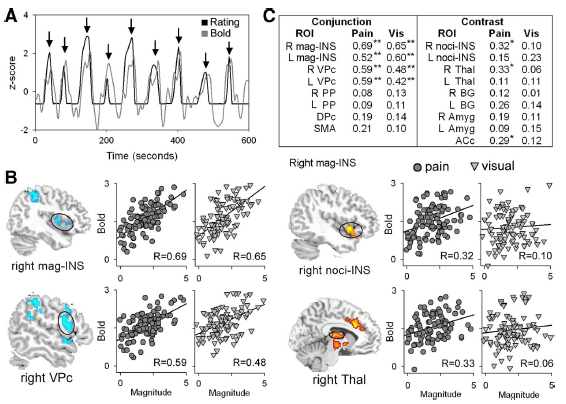
“FIG. 4. Brain regions encoding magnitude for visual and pain perceived magnitudes.
- “A: Example of blood oxygenated level– dependent (BOLD) signal and rating in standard units from one subject. Peak BOLD and rating were extracted for each stimulation epoch (indicated by arrows) and submitted for correlational analyses.
- “B: Correlation of BOLD with magnitude for 2 regions derived from the conjunction of variance-related map (blue) and contrast map (red). Scatterplots depict the degree of association between individuals’ region of interest (ROI) signal and magnitude for pain (circles) and visual (triangles) stimuli. The ordinate represents functional magnetic resonance imaging (fMRI) signal and the abscissa represents the magnitude rating for each stimulus epoch for each participant.
- “C: Correlation strengths between rated magnitude and BOLD for pain and visual stimuli across task (conjunction) and pain-specific (contrast) *P < 0.01; **P < 0.001. R, right; L, left.” (page 880) [emphasis added]
Professor: This data set and its analysis will form the crux of the disagreement by Moayedi and Weissman-Fogel. Based on dismissing or minimizing the following statements from Baliki et al.:
- “The results so far suggest that these sensory-magnitude–rating tasks involve two distinct functional constituents.
- “The first appears to be associated with rating performance, is correlated with the amount of information perceived by the subject, and is autonomous of sensory modality.
- “The second appears to be pain modality specific and does not account for the variability in perception.” (page 882, left column) [emphasis added]
Student: As you emphasized in your post, there are two ‘sub-networks:’
- First, a ‘sub-network’ deals with a general, non-modality-specific task of strongly estimating magnitude and
- Second, a ‘sub-network’ that signals specific information about the properties of the stimulus, that weakly includes magnitude.
FURTHER CRITICIAMS BY MOAYEDI AND WEISSMAN–FOGEL (2009)
Student: In the section entitled, “Intensity Coding,” Moayedi and Weissman-Fogel first wrote several paragraphs indicating
- their disappointment that Baliki et al. did not find significant contributions from the primary sensory cortex and anterior cingulate cortex corresponding to the regions that have been reported by previous researchers.
Professor: Then these critics wrote a paragraph with several sentences that
- were highly critical of the data analyses and conclusions made by Baliki et al.
Professor: On page 1346, left column, in first full paragraph, they started with an apparent paraphrase of a section header from the Methods section, “Pain-rating and visual-magnitude-rating tasks,” and wrote the following opening statement:
- “In Baliki et al.’s study, the subjects perform a pain-rating task and a visual-rating task.”
Professor: Then, the reviewers apparently chose some of the phases, or made substitutions, from Baliki et al., page 882, left column, first full paragraph:
- “bilateral VPC, the posterior parietal cortex, the [right] dorsal premotor cortex“; “right” was omitted.
- “SMA“
- mag-INS substituted as “insula“
- subregions substituted as “regions“
- “activity“
- correlation substituted as “correlates“
- “with variance“
- “both tasks“[emphasis added]
Professor: With these fragments, they assembled their next seemingly accurate sentence and perhaps set up a distortion:
- “The authors identified the bilateral VPC, the posterior parietal cortex, the dorsal premotor cortex, the SMA, and the insula as regions in which activity correlates with variance of both tasks.” (page 1346) [emphasis added]
Professor: Next, the critics wrote the following summary about the investigators’ most critical analysis which concerned the regions correlating with rating variance:
- “According to the basic tenet of the study, these regions form a bimodal functionally connected network that encodes the amount of information perceived or, simply put: the perceived intensity of the stimulus.” (page 1346) [emphasis added]
Professor: But I wonder which regions the critics were referring to! Maybe this paraphrased sentence was just for ‘setting up the scene’ for introducing a major distortion that is appears in the next sentence:
- “To further assess the function of these regions, the areas are discriminated based on whether they code for magnitude or variance: the activity of each region was correlated to magnitude ratings, although they did not correct for multiple comparisons.” (page 1346) [emphasis added]
Professor: Very interesting sentence! Where did all these words “discriminated based on whether they code for magnitude or variance” come from?! I sense ‘sleuthing’ is about to happen.
Student: How about looking at the phrases in the Section entitled “Coding for perceived magnitudes“ on page 882 of the Baliki et al. article?
Professor: Excellent suggestion! Those phrases or sentences may be the clues. I guess that the critics’ whole sentence must be deconstructed and compared to the original phrases.
Professor: in fact, some major paraphrasing could have been done by the critics.
- On page 1346, they substituted “To further assess the function of these regions,”
- for the phrase written by Baliki et al. on page 882, “To distinguish between these options,”
- They substituted ” the areas are discriminated based on”
- for the phrase written by Baliki et al., “we performed the ROI analysis”
Professor: Looks seemingly accurate paraphrasing so far. However, the next phase substitution seems like a distortion when
- they substituted “WHETHER THEY CODE FOR MAGNITUDE OR VARIANCE:”
- for the phrase written by Baliki et al., “EXAMINING NOCI-INS AND OTHER PAIN-SPECIFIC REGIONS (DERIVED FROM THE PAIN-VISUAL CONTRAST MAP) AND MAG-INS AND OTHER VARIANCE-ENCODING BRAIN AREAS [(derived from the conjunction of variance-related map)].”
Student: What a leap in logic! Does the phase “for magnitude or variance” means the same as, “noci-INS and other pain-specific regions (derived from the pain-visual contrast map) and mag-INS and other variance-encoding brain areas [(derived from the conjunction of variance-related map)]”?
Professor: No, not at all the same!
- A very big distortion! Substituting “or” highly misrepresents the phrases before and after the word “and” that Baliki et al. used in their article.
- Moayedi and Weissman-Fogel have now “emphasized” that the two areas of the insula are comparable magnitude estimators or encoders.
Student: Great detective work. And the next replacement does appear to be straightforward.
- The critics used the phrase, “the activity of each region was correlated to magnitude ratings,”
- for the phrase written by Baliki et al., “the extent of BOLD response in that region to be associated with each subjective magnitude rating of pain and/or visual stimuli.”
Professor: Indeed, Baliki wrote the following about the regions they found to be specific for pain (NOT MAGNITUDE) or specific FOR VARIANCE
- “Within brain regions reflecting task variance, bilateral mag-INS showed the best correlation with rated magnitudes for both pain and visual stimuli… Additionally, perceived magnitudes correlated with bilateral VPc…
- “Brain areas specifically activated for pain, including bilateral thalamus, BG, amygdalae, and anterior cingulate exhibited weaker correlations with magnitude during the pain-rating task, of which only right noci-INS…, right thalamus…, and ACc were significant.” (page 882, right column, first full paragraph) [emphasis added]
Professor: It appears the critics believe that both noci-INS and also mag-INS are to be declared as “magnitude estimators,” whereas the investigators concluded,
- “These results show that within brain regions reflecting task variance only mag-INS and VPc encode perceived magnitudes for both pain and visual stimuli.
- “Additionally, for the pain-rating task, modality-specific brain regions were also related to perceived magnitude, albeit with weaker correlations.” (page 882, right column, first full paragraph) [emphasis added]
Student: By the way, what about the criticism that there was “no correction for multiple comparisons.”
Professor: Please pardon me for adding more seemingly insignificant details. But technically, the methods for quantifying BOLD activities and perceptual ratings are the same in general.
- “[BOLD activities and] Pain and visual ratings were considered to generate a hemodynamic response.… The pain- and visual-rating derivatives rectified and convolved with the hemodynamic function…..
- “The significance of the model fit to each voxel time series was calculated, yielding statistical parametric… Average group statistical maps were generated using second-level random-effects group analysis.
- “A cluster-based correction of the z-statistic images was performed and thresholded at z-scores >3. For each resulting cluster of spatially connected voxels surviving the z threshold, a cluster probability threshold of P < 0.01 was applied to the computed significance of that cluster, which corrects for multiple comparisons [(Friston et al. 1995) referenced by Baliki et al.(2009]).” (page 879) [insertions and emphasis added]
Professor: In the next sentence of the critics’ second full paragraph in left column, page 1346, they continued their distortions by strongly emphasized the intensity coding role of the pain-specific parts of the insula by writing:
- “Also a second network specific to pain intensity coding is identified.” (page 1346) [emphasis added]
Student: And also this second network is subcortical.
Professor: Again the following sentence emphasizes the supposedly major function of the pain-specific insula areas as being intensity estimation:
- “The insular subregion of the nociceptive-specific magnitude estimator has a shorter latency than that of the bimodal magnitude network.” (page 1346) [emphasis added]
Professor: To be accurate, an appropriate revision of the above sentence would be:
- “The insular subregion [with] nociceptive-specific [sensory detection processors had] a shorter latency than that of the bimodal magnitude [encoding] network.” (page 1346) [insertions and emphases added]
Professor: And in the following next sentence, the phrase “entire insula“ ought to replace the word “insula“ because the critics, apparently wanted to de-emphasize the other roles of the insula’s subregions:
- “The authors provided evidence toward an integrative role for [the entire insula] in pain perception by demonstrating that the regions are connected, both anatomically and functionally, to sensorimotor regions, basal ganglia and amygdala.” (page 1346) [insertion and emphasis added]
Professor: And the last sentence of the critics’ paragraph inappropriately stresses that the investigators regard both mag-INS and noci-INS as having equivalent functions as “magnitude estimators” as follows:
- “Thus the authors have identified two areas that they propose are magnitude estimators in the brain: a bimodal one and a more-rapidly responding pain-specific one.” (page 1346) [emphases added]
Professor: Baliki et al., of course, had a more complete conclusion, and this is the quote of what they wrote:
- “Therefore mag-INS and VPc seem seminal in sensory magnitude integration.
- ‘Moreover, given that the relationship between perceived pain magnitudes and brain activity was highest in mag-INS and VPc,
- ‘this must be a consequence of integration of information from multiple pain-specific regions,
- ‘each of which shows a poorer correlation to perceived pain magnitudes.” (page 882, right column, end of first full paragraph) [emphasis added]
Student: Yes, the conclusion of Baliki et al. had many more words, and more accurately interpreted their results.
DO WE RATE SALIENCY AND/OR MAGNITUDE?
Professor: Well, we are not done yet. In the next paragraph, Moayedi and Weissman-Fogel wrote critical comments about other methodology issues.
- But at the end of the paragraph, they wrote this:
- “Moreover, the authors [Baliki et al.] did not test a stimulus with the same saliency
- “as that of the pain [intensity] task.” (page 1347) [insertion and emphases added]
Student: Huh?! Did I hear this correctly: Baliki et al. did not compare the task having a well defined pain stimulus, with another task having another stimulus but of the same saliency! What’s this about saliency?
Professor: Clearly, before we go much further, we must clearly understand the term “saliency.”
Take Home Points: Moayedi and Weissman-Fogel agree with Baliki et al. that there are two separate areas of the insula, one involved with generalized sensory magnitude integration, and the other specialized in nociceptive stimulus properties assessment, including a weaker estimation of magnitude. The two groups differ in that:
- Baliki et al. interpret their results as evidence that mag-INS is part of the task control network and that noci-INS is part of the nociceptive network.
- Moayedi and Weissman choose that they are parts of separate magnitude estimating networks.
Coming up next: What are the various definitions of “saliency” or “salience;” how can different stimuli be tested for degrees of salience; how is salience detected; and what is the relationship between salience and the salience network?
References
Baliki MN, Geha PY, Apkarian AV. Parsing pain perception between nociceptive representation and magnitude estimation. J Neurophysiol 101: 875–887, 2009. DOI:10.1152/jn.91100.2008.
Borg G. (1998) Borg’s Perceived Exertion and Pain Scales. Champaign, IL: Human Kinetics.
Miller GA. (1956) The magical number seven, plus or minus two; Some limits on our capacity for processing information. Psych Rev 63: 81-97.
Moayedi M, Weissman-Fogel I. (2009) Is the insula the “how much” intensity coder? J Neurophysiol 102:1345-1347. DOI:10.1152/jn.00356.2009.
Shannon CE, Weaver W. (1949) The mathematics of communications. Urbana: Univ Illinois Pr. Cited in Seisling R. (2010) Cybernetics, system(s) theory, information theory and fuzzy sets and systems in the 1950s and 1960s. Info Sci 180: 4459-4476.