Professor: This post will continue following someone experiencing a mild pulmonary inspiratory obstruction, like putting on a surgical mask to reduce symptoms of asthma in cold weather. In this post, we will discuss:
- switching attention from being fully alert; to
- planning, selecting, and activating motor responses.
Student: What about:
- consciously detecting and recognizing this event, choosing a verbal description, scaling it, and using the scaled words to report our level of dyspnea.
Professor: Regrets, it’s snow time out here in Pennsylvania, and that discussion will now be in Part 3, the final post of this series.
Student: As a model, we used Figure 5 of Menon & Uddin (2010) with their five stages for processing sensory input and attentional control. The sixth stage we will add about Subjective Report.
Professor: And, what processes were covered during Stages 1 – 3?
Review of Stages 1 through 3
Student: Stages 1 and 2 dealt with being stimulated by our breathing, and definitely these stages were processes that very quickly activated the Salient Network (SN):
- Stage 1: CONTACT has been made.
- About 150 ms post-stimulus, the primary sensory areas, including posterior insula (PI),
- detected ‘deviant’ local activities.
- Stage 2: So, WAKE UP!
- Within several more milliseconds, a “bottoms-up” amplified signal was quickly transmitted to other brain regions, including the anterior insula (AI) that
- then triggered a strong response in the anterior cingulate cortex (ACC).
- Stage 3: Executives, Shift to Fully ALERT!!!!
- About 200 – 300 ms post-stimulus, the SN sends out “top–down” control signals to the central executive network (CEN) as well as
- to the default mode network (DMN).
Review of Networks’ Nodes Discussed So Far
Professor: First, I want to make sure we are all clear about the SN, CEN, and DMN networks by reviewing their actual pathways and concentrating on the pivotal role of the insula:
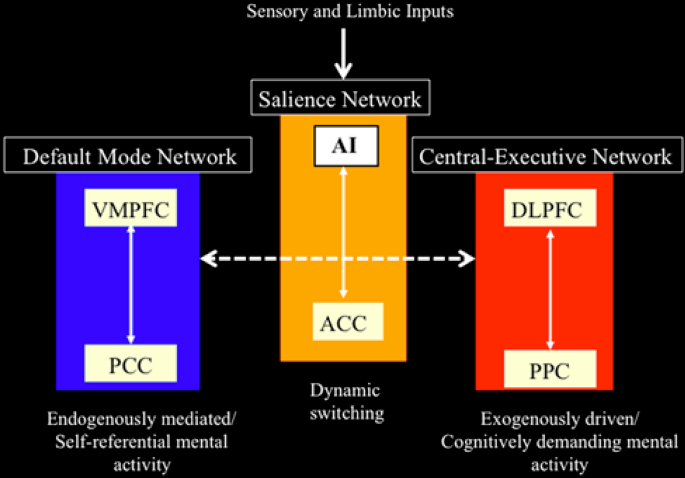
Professor: Above is Figure 4 from Menon & Uddin (2010). It is their network model that highlights anterior insula function. To paraphrase their figure legend:
- notice at the very, very top of the Menon & Uddin model, that the inputs arrived from sensory and limbic systems and are initially processed by the anterior insula (AI);
- the AI is a node for the salience network, working closely with the ACC SN node;
- the AI and ACC intensely initiate dynamic switching between the CEN and DMN.
Professor: I want to add some more details about the CEN, DMN, and other networks:
- Two lateral cortex areas locate the nodes of the CEN:
- the dorsal lateral prefrontal cortex (DLPFC) and
- the posterior parietal cortex (PPC),
- Two medial cortex areas locate the nodes of the DMN:
- the ventral medial prefrontal cortex (VMPFC) and
- the posterior cingulate cortex (PCC), and
- Other distributed neural circuits comprise “task-specific” networks.
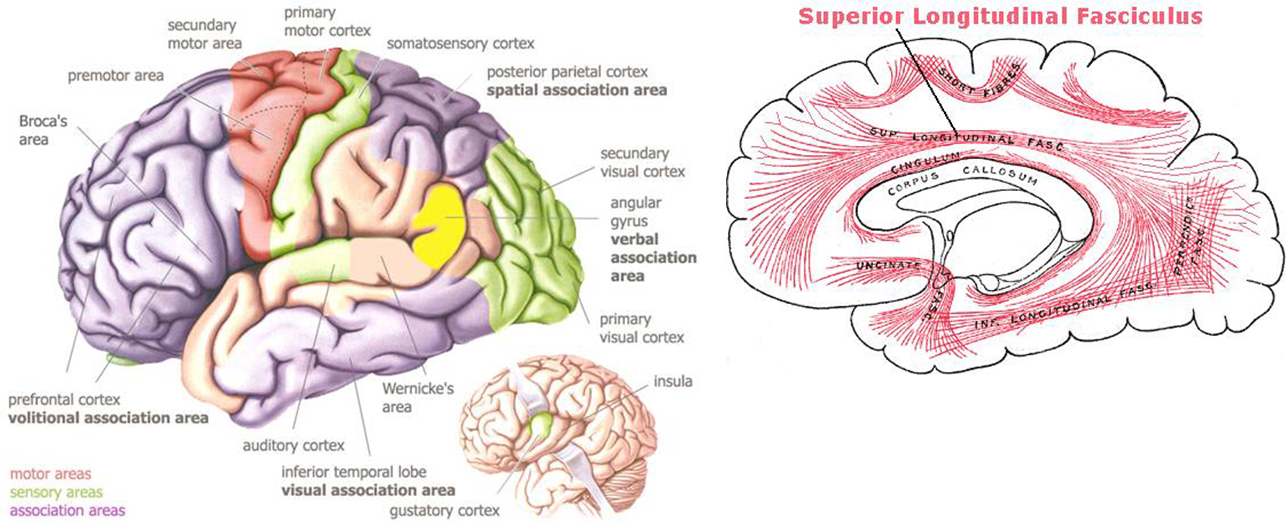
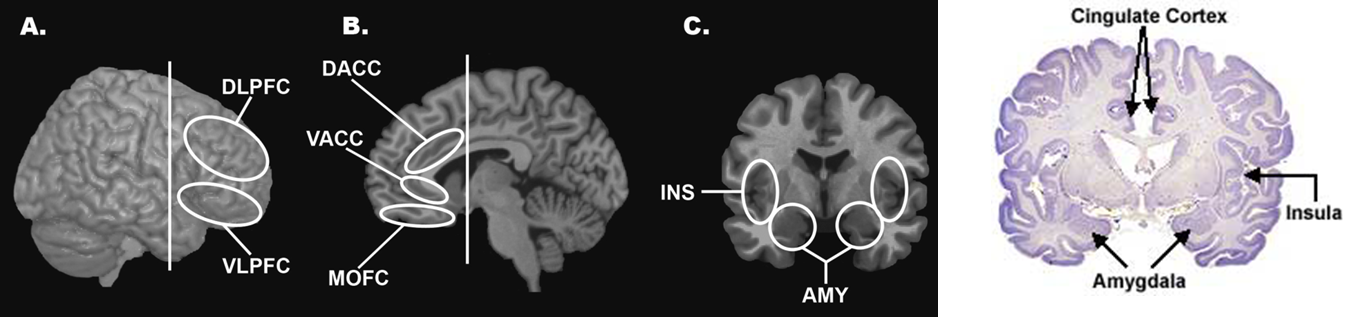
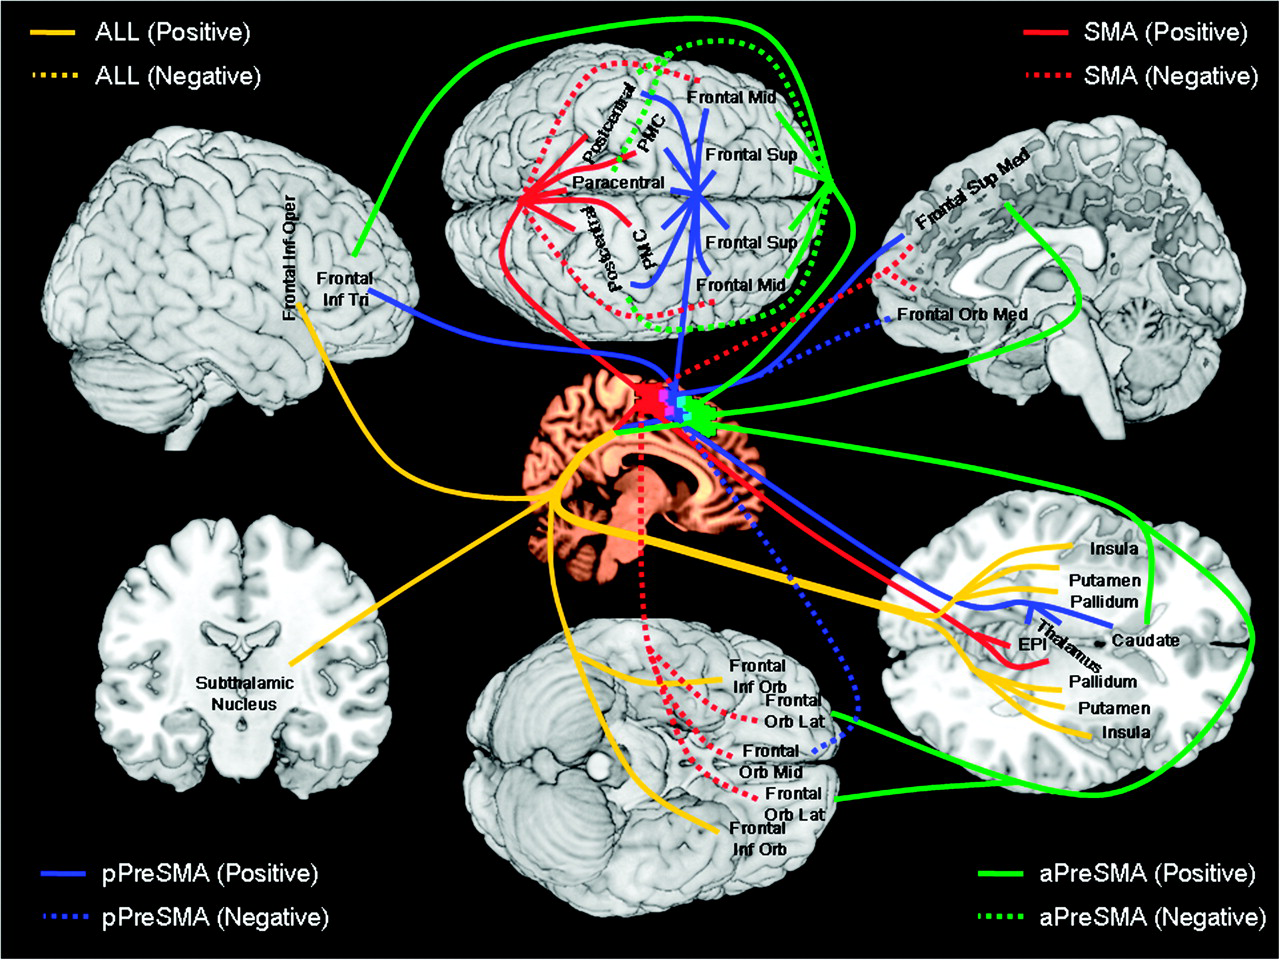
Student: Hey! Colorful pictures. Thanks for putting these detailed illustrations of the neuroanatomy and actions for these areas down at the bottom of this post (Go to see these cortical areas).
Professor: I hope they are helpful for the ‘out-of-the-loop’ folks. Now, after about 200 – 300 ms post-stimulus, our mind has shifted its attention and is ready for action/reaction during the upcoming Stage 4:
Stage 4: Higher cortical regions, especially the premotor cortex along with the temporo-parietal areas, respond to this attentional shift.
Professor: Basically, the control signals from DLPFC and PPC of the central executive network ‘turn off’ the cognitive activities of the VMPFC and PCC of the Default Mode Network. Menon & Uddin (2010) have reviewed a study using a specific task to provoke increased CEN activity accompanied by decreased DMN activity.
Student: Please tell me more about this task!
Professor: It was an “oddball” task that was utilized by Sridharan et al. (2008):
- it involved the detection of an infrequent blue circle embedded within a sequence of many, frequent green circles and presented in the center of the black screen;
- their results suggested that rAI was tonically alert for the infrequent colored circle; and
- NOTICE that in this task there was a different colored circle.
Student: That is a weird kind of an oddball!
Professor: Let’s turn to Figure 3 in the review of Menon & Uddin (2010) and discuss the information flow during this “oddball” task. These streams are among the major nodes of the salience, central executive, and default mode networks.
Review of Networks’ Nodes Discussed So Far
Professor: First, I want to make sure we are all clear about the SN, CEN, and DMN networks by reviewing their actual pathways and concentrating on the pivotal role of the insula:
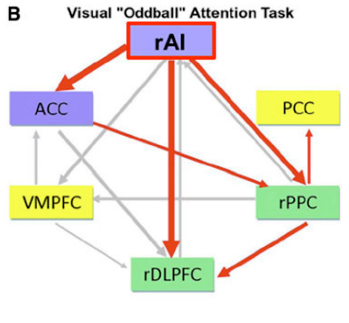
Professor: Above is their Part B of Figure 3. The Saliency Network has blue filled rectangles; the Central Executive Network has green filled rectangles; the Default Mode Network has yellow filled rectangles; active outflows are red arrows; inactive outflows are gray arrows.
Professor: As emphasized in their Figure 3 legend, only the right AI (rAI) had a large excitatory outflow to its companion ACC nodes. Also, rAI inhibitory had outflows to the CEN’s rDLPFC and rPPC nodes. The activation of ACC also reinforced inhibition of the rPPC. These connection analyses, together with latency analyses, suggested to Menon & Uddin (2010) that the rAI:
- “functions as a causal outflow hub for the detection of [critical,] salient events” and
- “initiates network shifting.”
Professor: However, this was certainly an “oddball” lab study. An actual situation was studied by Hasenkamp et al. (2012):
- who also confirmed the results of Sridharan et al. (2008) and
- who had participants ‘be alert for any mind wandering’ and then make a shift back to a sustained focus :
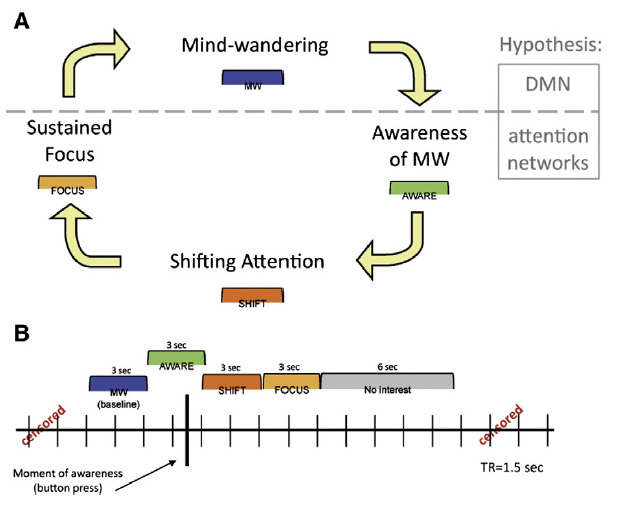
Professor: The legend for Figure 1 indicated that Panel A has a horizontal gray dashed line representing a hypothesized division between DMN and task-positive attention network activity during these states. Panel B is a model for the construction of phases relative to the button press (represented by the heavy black vertical line).
Professor: In this study, the only thing the participants had to do was to lie down in a MRI scanner and try to meditate on breathing in and out. Figure 1 above indicates that:
- the key task was to NOTICE when one was not attending to the object of meditation, i.e., on THE BREATH; and
- at the moment of ‘awareness’ they pressed a button.
Student: I just re-read your August 1, 2013 post, I-must-reconnect-to-THE-BREATH, and here is my summary of the phrases:
- Oops, not noticing THE BREATH: In the 3 seconds containing the button push, i.e., the AWARE phase (that was when a MRI scan contained the button push) the active areas were chiefly in the midbrain, left posterior insula and, of course, the SN.
- Sent out the Alert: In the SHIFT phase, the CEN and subcortical areas became active.
- Keep on keeping on: During the FOCUS phase, activation persisted within the CEN’s right dorsolateral PFC, but only in this brain region, perhaps to maintain sustained attention on THE BREATH.
- Being Distracted: Sometime later, the MW phase was associated with activations in the DMN areas, perhaps used for internal thinking/day dreaming and, in addition, the ‘motor’ preparation areas for the button push.
Student: I have encouraged others to look at the MRI illustration for these stages. In fact anyone could click this link, , I-must-reconnect-to-THE-BREATH, and read about this important study.
Professor: Thanks, and of course, the key to all these studies is the word ATTENTION. Now, in our example, discomforting breathing has gotten our full attention; in order to consider what action to take, and, in deciding whether or not to do it, we will be using the activities of Stage 5:
Stage 5: The ACC also facilitates response selection and motor response via its links to the midcingulate cortex, supplementary motor cortex, and other motor areas.
Professor: Still getting hard to breathe, eh?! Well, your motor networks can help you:
- keep on doing what you are doing, or
- freezing, or
- taking action by doing something else.
Student: Right now, I think it’s time to take two puffs from a medication inhaler, the one I use for treating bronchospasms.
Professor: A great opportunity! Let’s have our example take place where you can make a visually-assisted grasping of your inhaler.
Student: Well, let’s say that the inhaler is on a dresser in my bedroom, and I could either:
- hop over my bed to grab it, or
- walk slowly around my bed to pick it up without getting any more short-of-breath.
Professor: And you get to make a choice! The review of Cisek & Kalaska (2010) can help specify, select, execute, and fine tune your route.
- They reviewed how monkeys and humans decide what movement to do and how to do it, and
- they even illustrated their review with the data, results, figures, and conclusions from the amazing study of Ledberg et al. (2007), that
- uses simultaneously recorded, local field potentials from multiple sites across the brain of awake, behaving monkeys
- while they perform a very similar conditional Go/NoGo task, pressing and choosing whether or not to release a lever.
Student: I do act like a monkey some times.
Professor: Therefore we can substitute the suggested neural mechanism from the review of Cisek & Kalaska for a monkey’s visually-guided reach-and-grasp task that is shown below:
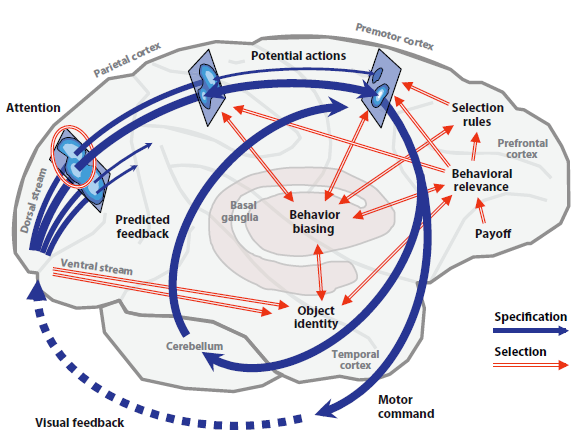
Professor: Note their figure 1 shows our primate brain, emphasizing the cerebral cortex, cerebellum, and basal ganglia. Their figure legend is expanded with my comments below:
- At the far left, the monkey’s eyes feed information into the beginnings of the parallel processing and diverging dorsal and ventral streams in the visual cortex.
- Dark blue arrows are the dorsal stream,
- represent the processes of action specification, the “what to do” pathways, which
- transform visual information into neural representations of several or many potential actions.
- Blue ovals on rectangles portray the representations for three neural populations along this dorsal route.
- Ledberg et al. (2007) confirmed that a very fast, feedforward sweep, of evoked potential activity, that was stimulus onset-related, occurred
- within 55–80 ms in the frontal eye fields and premotor cortex via the dorsal stream and
- within 50–70 ms in the visual cortex via the ventral stream.
Student: Those neural circuits are really ‘fast out of the starting blocks’!
Professor: This seems to hold for any reactive task. At this point, both the dorsal and ventral streams are transmitting information to each other, concentrating on clarifying action specification. The following paraphrases the Figure 1 legend of Cisek & Kalaska (2010):
- Notice that each of the three neural populations is depicted as a map
- where the lightest regions correspond to peaks of tuned activity, and
- which then compete for the final action specification.
- Red double-line arrows are the ventral stream
- that represent input from the initial visual cortex and
- input from the basal ganglia and prefrontal cortical regions,
- that collect and process additional information for final action specification,
- This information sharing that occurred somewhat later with the dorsal stream circuitry providing biasing selection:
- discerning information about motor output parameters like direction of different stimulus categories,
- happening within approximately 100 ms of onset in visual association areas of the monkeys and
- within 200 ms in their prefrontal sites.
Student: No anxious hesitation is happening when monkeys have full attention on its task performance!
Professor: Finally this visually-guided movement selection utilized computations of object identity, assessment of behavioral relevance, and prefrontal rules for a final action specification, i.e., “winner-takes-all.”
- The monkey’s Go/NoGo decision processing
- appeared approximately 150 ms after stimulus onset and
- occurred nearly simultaneously, within a diverse interacting “mosaic” of cortical sites, including visual, motor, and executive control areas, until
- it resulted in the post-decision subprocesses that were involved with coordinating the final motor execution.
- The selected action is ‘disinhibited into execution’ (i.e., “GO!”) and is then fine-tuned by:
- external, overt feedback from the environment (dotted blue arrow), as well as
- internal reafference , i.e., collateral, predictive feedback provided by the cerebellum.
Student: Then, how fast does all this take place?
Professor: It takes less than 0.3 s, i.e., less than 300 ms, for the overall reaction time to release the lever.
Student: Wow! All that just to release a lever or not.
Professor: To release or not! I wonder if you are you inferring that there is another final gate involved. And YES, states Hanakawa (2011), with his notion of a “firewall-like” rostral premotor gateway.
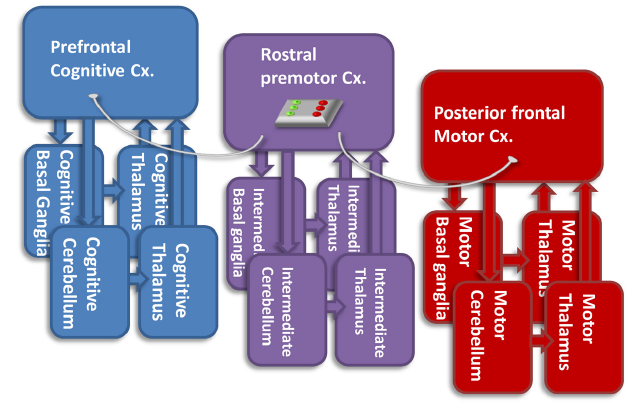
Professor: Above is his challenging Figure 3. Briefly, it is his hypothetical view of the functions of the rostral premotor-subcortical network (Cx.) for connecting the prefrontal cognitive and the posterior frontal motor networks. He recognizes that:
- the “pure motor” posterior frontal network has direct connections with the spinal cord,
- but it does not directly interconnect with the “cognitive” network.
Professor: Hanakawa suggests that one of the functions of the rostral premotor-subcortical network may be gating, i.e., connecting/disconnecting the cognitive and motor networks, depending on the context.
Student: Well, then the rostral premotor-subcortical network acts like a Motor Gate, just like the Thalamic Reticular Nuclei act like a Sensory Gate!
Take Home: So far, we have learned about turning our attention fully to our uncomfortable breathing and using visually-guided reaching to get a inhaler. Now how do we verbally communicate the effect of taking the bronchodialator from the inhaler?
Next: Stage 6: Subjective Report is the next and final stage of perceptual processing post for this blog.
References
Cisek P, Kalaska JF (2010) Neural mechanisms for interacting with a world full of action choices. Annu Rev Neurosci 33: 269–98. doi: 10.1146/annurev.neuro.051508.135409.
Hanakawa T. (2011) Rostral premotor cortex as a gateway between motor and cognitive networks. Neurosci Res70: 144–154. doi: 10.1016/j.neures.2011.02.010.
Hasenkamp W, Wilson-Mendenhall CD, Duncan E, Barsalou LW. (2012) Mind wandering and attention during focused meditation: A fine-grained temporal analysis of fluctuating cognitive states. NeuroImage 59: 750–760. doi: 10.3389/fnhum.2012.00038.
Ledberg A, Bressler SL, Ding M, Coppola R, Kakamura R. (2007) Large-scale visiomotor integration in the cerebral cortex. Cereb Cortex 17 (1): 44-62. doi: 10.1093/cercor/bhj123.
Menon V, Uddin LQ. (2010) Saliency, switching, attention and control: A network model of insula function. Brain Struct Funct 214: 655–667. doi:10.1007/s00429-010-0262-0.
Sridharan D, Daniel J. Levitin DJ, Menon V. (2008) A critical role for the right fronto-insular cortex in switching between central-executive and default-mode networks. Proc Natl Acad Sci USA. 105: 12569–12574. doi/10.1073/pnas.0800005105.
Supplement (being finalized)
Return
Figure S1. The cortical areas and white tracts (fasciculi) that connect them:
text
Figure S2. The specific locations of DLPFC, VLPFC, DACC, VACC, Insula and Amygdala:
text
Figure S3.
text
Figure S4.
text
Return