Professor: Dr Arthur Dickinson, I apologize for leaving your name off the Stockholm article and presentation. In fact, Art’s Applied Exercise Physiology Lab was the actual location of the study.
Student: Wasn’t this presentation based on a preliminary analysis of Dave Stamper’s MS thesis with Dr Art Dickinson as his advisor and in Art’s lab?
Professor (remorsefully): Yes and Yes. My regrets.
Student: Thank you. And what kind of clues did you find between physiology and perceptions?
Professor: Our working hypothesis was that:
any impairments in the functioning of the motor and cardio-pulmonary systems would be associated with an increase of symptom severity that would influence the duration [of] a constant work task.
Professor: Please right click the following link and download the PDF if you want to look at the methods, etc.: Stockholm 1975 Presentation
Student: Okay, what were the results?
Professor: Eleven (11) participants cycled at about 65% VO2 max with the large range in ride duration was from 9.87 min to 68.95 min. The riders were divided into three groups as shown in the table below:
Table Work performance characteristics (±SEM)
| Table. Work performance characteristics | |||
|---|---|---|---|
| Group | VO2 max (ml/kg/min) | Workrate (%VO2 max) | Duration (min) |
| I- Least Fit (n=3) | 47±4 | 67±5 | 13±3 |
| II- More Fit (n=4) | 58±11 | 70±4 | 25±5 |
| III- Most Fit (n-4) | 59±6 | 62±7 | 59±6 |
Student: The overlap in SEM for work capacity and workrate indicates no statistical differences between groups, right?
Professor: Correct! The locomotor data is shown in the figure below:
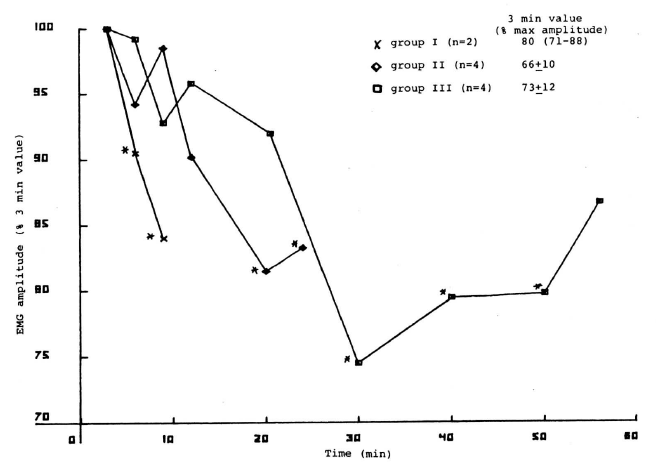
Figure 1. Increase in Leg Fatigue Score (from 3-min value) as function of ride time.
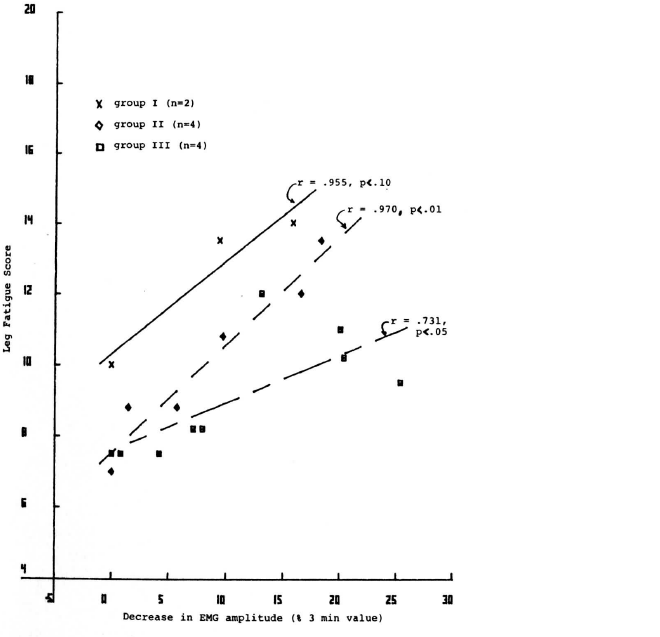
Figure 2. Association of increased Leg Fatigue Score with decrease in EMG amplitude
Student: Wow, look at the different slope for time plot of Leg Fatigue score. And the correlation coefficients versus decrease in EMG amplitudes were quite high: 0.959, 0.970, and 0.731 for groups I, II, & III.
Professor: Also, during the prolonged cycling, the duration of EMG bursts also decreased. Thus, during prolonged work, the more the group could ride before stopping, the less rapid were the changes in vastus lateralis EMG activity and leg fatigue symptoms.
Now for the changes in cardio-pulmonary physiology and distress scores:
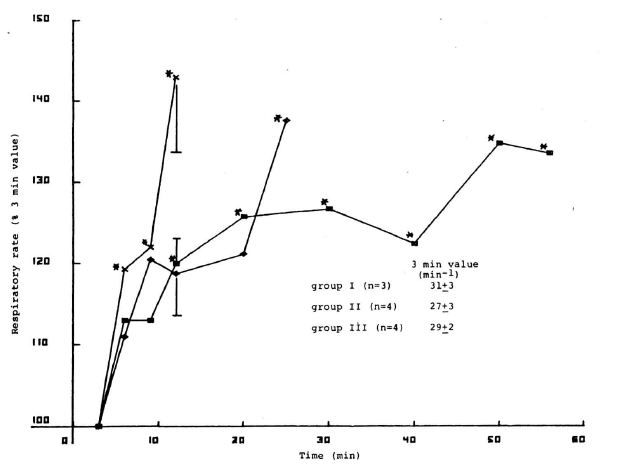
Figure 3. Increase in Cardio-Pulmonary Distress Score (from 3-min value) as function of ride time.
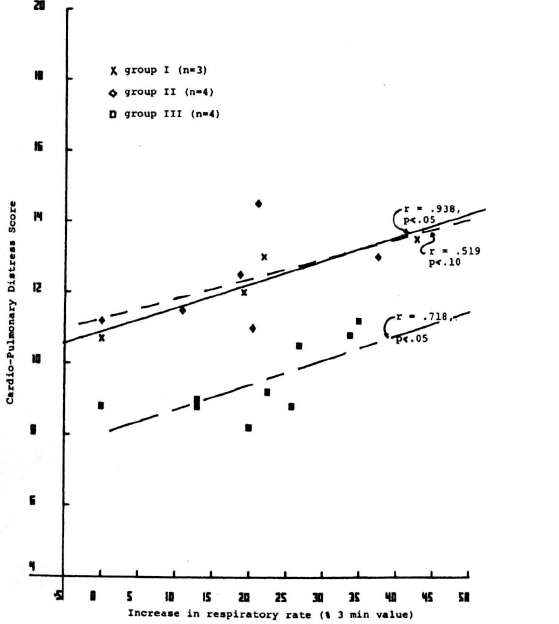
Figure 4. Relation of Cardio-Pulmonary Distress Score to the increase in respiratory rate
Student: Group I showed a continuously rapid increase in respiratory rate; Group II plateaued and then increased at the end of the ride; Group III showed a slightly increasing plateau. In Panel F, each group increased in Cardio-Pulmonary Distress Score that was significantly associated with the increase in respiratory rate with all groups having similar slopes.
Professor: With prolonged work, the tidal volume decreased slightly and the heart rate increased slightly for all groups. Thus, during prolonged work, as heart rate, respiratory rate increased and tidal volume decreased, cardio-pulmonary symptom severity increased.
Student: RPE routinely used to monitor exercise intensity. What happens during prolonged performance?
Professor: In the study reported in Stockholm, we also found that RPE increase from 3-min to end of ride similar to Leg Fatigue score increase. Two other studies also give us information on RPE and exercise duration.
First, Noakes (2004) plotted from the data in Table 1 of Baldwin et al. (2003):
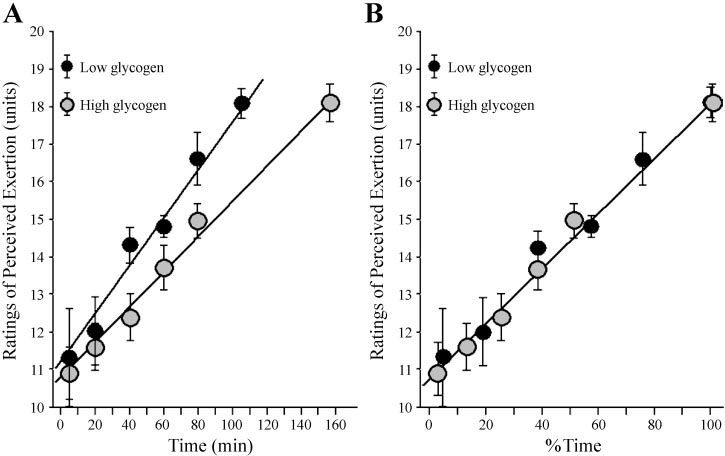
Professor: Above is his Figure 1 plotted from the data in Table 1 of Baldwin et al. (2003):
- In Panel A, the absolute ratings of perceived exertion (RPE) were plotted against absolute exercise duration (minutes). It showed “that, regardless of whether exercise begins with low or high muscle glycogen content, there is a linear increase in RPE with exercise duration.
- In Panel B: when the RPE for both exercise conditions is plotted against the % of total exercise time (completed or remaining), the data fall along the same line.
Noakes concluded that the data suggest:
- the maximal RPE that can be sustained determines the time at which the decision is made to terminate exercise and
- the rate at which the RPE increases may determine the duration of exercise specifically to ensure that total energy depletion does not occur in the active muscles during more prolonged exercise.
Student: That is quite a teleological conclusion.
Professor: Well, he seems to have a teleologic anticipation outlook on these phenomenon.
Second, Presland, Dowson, and Cairns (2005) also looked at RPE responses during prolonged cycling. Below is their Fig. 1:
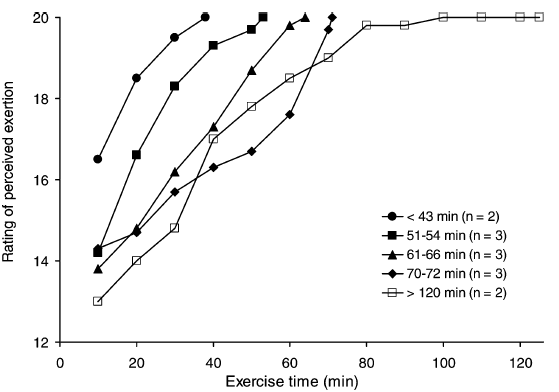
Fig. 1 Rating of perceived exertion (RPE) as a function of exercise time during prolonged cycling at 70% VO2peak. The Borg category scale was used for overall whole body effort. Thirteen subjects were grouped based on their times to exhaustion with mean values shown. The RPE are shown at 10 min intervals for clarity.
Professor: Their Fig. 1 clearly illustrated the progressively increased slope for absolute RPE as the riders end-of-ride times decreased.
“The time to exhaustion was 69±26 min (n = 15) and showed considerable variation between subjects (range 32–126 min). … Whole body RPE increased progressively throughout exercise from 11±2 (fairly light) at 2 min to the maximum level of 20±0 at exhaustion for every subject tested. The time-course for changes in RPE for subjects grouped according to their time to exhaustion is shown in Fig. 1. The group that became exhausted the most rapidly had the highest RPE early into exercise and their RPE climbed the most rapidly. … In addition, the individual data show that the time to exhaustion was inversely related to the RPE at 15 min of exercise (r = -0.74, P < 0.05).”
Student: Thus, the less ‘fit’ the person is, the more rapid is the increase in RPE. Does the more rapid increase in perceived exertion at a relatively constant workrate indicate fatigue is occurring?
Professor: This is only an association! We must look for possible linkages in between the correlated phenomenon. Where are the Impaired linkages? That is a mystery; that’s where the mechanism is fuzzy.
Student: Then, what are the possible linkages between Discreet Symptoms and their underlying Physiological Substrata?
Professor: The linkages are hard to define; however, the They can be very roughly categorized as grouped into the following:
- Motor command activity
- Locomotor muscle activity
- Peripheral sensory input
- Spinal motor reflex activity
- Sensations and efference copies
- Supraspinal mechanisms for awareness, perceptions, and symptoms
- Reporting of symptoms
- Feelings and emotions
Student: In that list are a lot of fuzzy areas
Professor: We looked at the in the increase of breathing rate and its correlation with cardio-pulmonary distress. A lot has been done to clarify the linkages that impact patients with shortness of breath.
Take Home Message: Mechanisms processing sensory signals into sensations and into perceptions has many fuzzy area.
Next: pain Cardio-pulmonary symptoms connection to the very possible mechanisms in patients and at high altitude.
References:
Baldwin J, Snow RJ, Gibala MJ, Garnham A, Howarth K, and Febbraio MA. Glycogen availability does not affect the TCA cycle or TAN pools during prolonged, fatiguing exercise. J Appl Physiol 94: 2181–2187, 2003.
Noakes 2004
Presland, Dowson, and Cairns 2005
Weiser PC, Stamper DA, Dickinson AL. (1977).
Weiser PC, Stamper DA, Kinsman RA, Hannon JP. (1971) Relationship of heart rate increment during exercise to the time of exhaustion. Fed Proc 30: 372.