Student: Ough, I hurt my left knee running this week. And it’s hard not to be limping. It’s sorta like walking on a split-belt treadmill!
Professor: Well, another recent study from Bastian and colleagues gives us more information on limping. Specifically, Malone and Bastian (2010) studied the effects of “conscious correction versus distraction” upon ‘limping’ during adaptation to split-belt walking. Below is their Fig. 1 showing their methods:
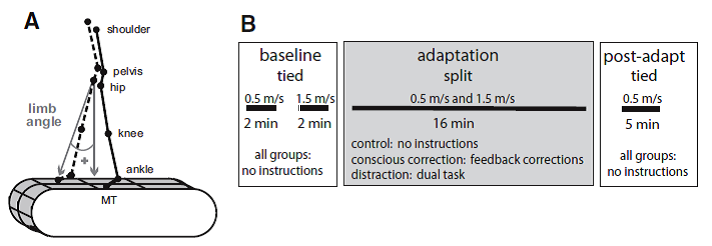
FIG. 1. A: diagram of marker location and limb angle convention. B: experimental paradigm showing the periods of split-belt walking and conditions.
Professor: The methods of previous post (Perturbing Infants Locomotor Patterns With A Split Belt Treadmill) from a study of infants by Musselman, Patrick, Vasudevan, Bastian, and Yang (2011) are very similar to this study by Malone and Bastian. However, Malone and Bastian studied adults, and the experiment had two baseline periods each at the different speeds, a fixed adaptation period, and a fixed de-adaptation period. Notice: Malone and Bastian used as 3:1 fast:slow split-belt ratio instead of the 2:1 ratio Musselman et al utilized. Malone and Bastian also studied three groups of subjects each having different instructions. Their detailed description of the groups state that,
- “Subjects in the control group were given no instructions (n = 11).
- “The conscious correction group was given on-line visual feedback of their steps and instructed to “keep their step lengths equal on both sides” during the entire adaptation block (n = 11). To allow subjects to develop their own error monitoring and correction mechanisms, the experimenter demonstrated what was defined as a step length until the subject had an understanding of the parameter, but allowed the subject to monitor his/her own errors (i.e., the experimenter did not comment on the step lengths) once the experiment began.
- “The distraction group (n = 11) watched a television program unrelated to walking and were told to count the number of times a particular word was said using a handheld counter. Additionally, subjects in the distraction group were asked to focus their attention on the television so that they could answer questions about the program’s visual scenes after the adaptation block finished. Therefore the subjects were distracted by audio and visual stimuli.” [Numbering and emphases added.]
Student: Ahh, distraction as a dual-task I have been taught interfers with motor learning.
Professor: Right. Malone and Bastian instructed each of their subjects to alter their step lengths as they wanted and analyzed them as shown below in their Fig. 2:
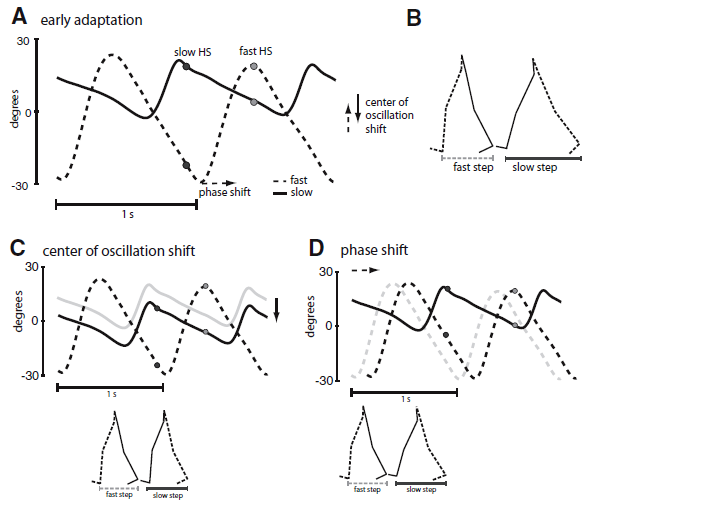
FIG. 2. A: limb angle trajectories plotted as a function of time in early split-belt adaptation—2 cycles are shown. Positive limb angles are when the limb is in front of the trunk (flexion). Two time points are marked—slow heel strike (HS) in black and fast HS in gray. The spread between the limb angles is directly proportional to the step lengths shown in B. Step lengths can be changed through alterations in phasing (lag time at peak cross-correlation) or through a shift in the center of oscillation (midpoint angle of the limb between heel strike and toe off for each leg). B: stick figure diagram of the legs taking 2 consecutive steps. C: step lengths can be equalized through a shift in the center of oscillation (purely spatial change). Gray trajectory represents the slow limb in early adaptation. A spatial shift in the slow limb’s center of oscillation can result in equal step lengths. D: a phase lag (purely temporal change) in the fast limb from the gray trajectory (early adaptation) to the black trajectory will also equalize the step lengths.
Professor: One of the step symmetry parameters utilized by Malone and Bastian was identical as reported by Musselman et al. (2011). A measure of “purely spatial change” was again determined by symmetry of the difference in center of oscillation between the two legs (for further explanation, see the previous post and Fig. 2 legend above).
But to measure “purely temporal change”, Malone and Bastian used a phasing parameter, i.e., the shift in timing, “… between the legs’ motions. Phasing was determined using the time series of limb angles for each leg (Choi and Bastian 2007). It was calculated as the lag time at peak cross-correlation … of the limb angle trajectories over one stride cycle (Choi and Bastian 2007). Possible phasing values ranged from 0 to 1 stride cycles, with symmetric walking having a value of 0.5 (i.e., [normal] out-of-phase walking). The slow leg was the reference leg in this analysis.”
Furthermore, Malone and Bastian calculated how fast adaptation and de-adaptation took place:
“The rates of adaptation and deadaptation for each parameter were quantified on a subject-by-subject basis. Individual curves were smoothed with a moving average and binned by three strides, and a calculation on the number of strides it took for each subject to reach a plateau in his/her behavior was done. The plateau range was defined as the mean±SD of the last 30 strides. In a few cases, an individual subject’s variability decreased at the end of adaptation. In this situation, we calculated the plateau range, once the behavior reached plateau but before the variability decreased. The beginning of the plateau was determined as the first point at which five consecutive strides fell within the plateau range for each period. The advantage of this rate calculation is that it is agnostic—it does not assume that the subjects follow a specific pattern as, for example, would a single or double exponential fit. ” [Emphases added.]
Student: Hey, when are you going get to the results?
Professor: Look below at their Fig. 3:
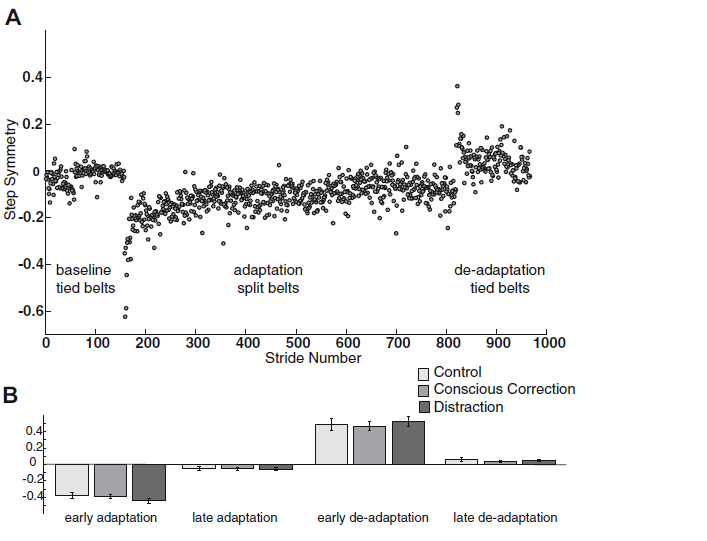
FIG. 3. A: example of single subject (control) step symmetry data for the entire experiment. In baseline and deadaptation periods, the belts were tied (same speed). In the adaptation block, belts were split (3:1 speed ratio). The visual feedback and dual-task conditions were only used during the adaptation block. B: subjects did not differ in step symmetry during periods of early adaptation (P = 0.27), late adaptation (P = 0.96), early deadaptation (P = 0.83), and late deadaptation (P = 0.52). [Emphasis added]
Professor: First, Fig 3A shows the data for step symmetry of a single control group subject.
Student: Wow, look at the hugh shift in negative symmetry for the first few steps in adaptation and a big positive asymmetry for the first steps in de-adaptation!
Professor: Fib. 3B shows the means for first 5 steps and last 30 steps during adaptation and de-adaptation. NO significant differences were found for either early or late adaptation and for either early or late de-adaptation. They summarized the findings as,
- “In other words, no group learned more than the others by the end of adaptation.
- “…all groups washed out the learned pattern to similar extents by the end of the de[-]adaptation period and resumed a near symmetric walking pattern ….”
- “Thus the magnitude of change in behavior during adaptation and deadaptation was similar across groups.” [Bullets added]
Professor: And take a look at curves for adaptation and de-adaptation in their Fig. 4:
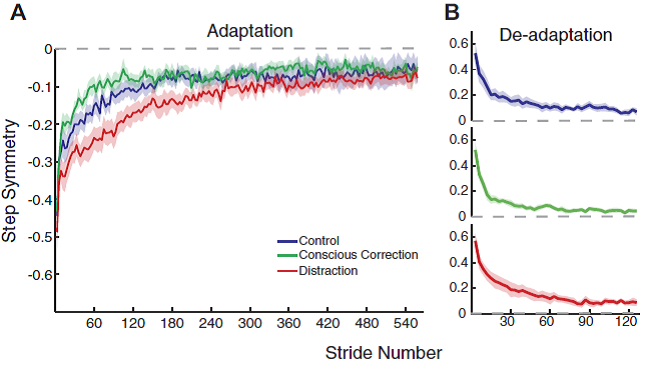
FIG. 4. Adaptation and deadaptation curves for step symmetry. A: average adaptation curves for the 3 groups, with SE indicated by the shaded area. Baseline values are subtracted out from curves (i.e., symmetry is indicated by a value of 0). B: average deadaptation curves for the 3 groups. Recall that all groups deadapted under the same condition (no feedback or distraction). Curves are shown individually to more clearly show the plateau level.
Professor: Note not the end of adaptation but rather the starting curves for adaptation and de-adaptation! In fact. the rates disclosed unexpected results as shown in their Fig. 5:
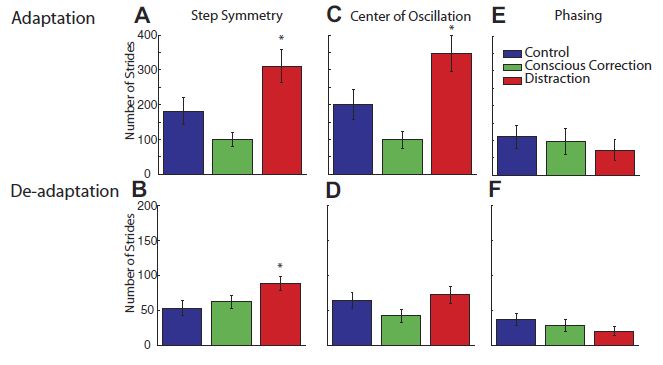
FIG. 5. The adaptation and deadaptation rate expressed as the number of strides until a plateau is reached for each measure. A: for step symmetry, distraction subjects adapted slower than control and conscious correction subjects. Whereas conscious correction subjects tended to adapt faster than control subjects, this difference did not reach significance. B: for deadaptation, distraction subjects also took longer to reach a plateau than the control and conscious correction subjects. The rate of deadaptation was similar for conscious correction and control subjects. C: similar trends are shown for rate of adaptation in center of oscillation difference, compared with step symmetry. Distraction subjects took the longest to adapt vs. control subjects and conscious correction. D: deadaptation in center of oscillation difference is similar to adaptation. The conscious correction group adapted fastest, then control, and distraction was the slowest. E: all groups adapted phasing at similar rates. F: deadaptation rate for phasing was also similar across groups.
Professor: Concerning these results, Malone and Bastian stated,
” During adaptation, the conscious correction group reached plateau slightly [fewer steps] than the control group, which was faster than the distraction…” [See Figure 4B in the PDF copy of article.]
“Post hoc analysis (Fig. 5A) showed that the distraction group rate [the first 5 steps] was different from both the control group (P = 0.02) and conscious correction group (P < 0.01), while the difference between control and conscious correction was not significant (P = 0.14). Thus, all groups adapted to the split-belt perturbation, but the rate at which subjects adapted differed depending on the training method that was used, with distraction being slowest.”
“Generally speaking, subjects de[-]adapted much faster than they adapted, regardless of group. However, post hoc analysis shown in Fig. 5B showed that distraction was different from control (P = 0.02) and trended toward different from conscious correction (P = 0.07), whereas there was no difference between control and conscious correction (P = 0.51).
And about temporal vs spatial symmetry, they state,
“There are two strategies that subjects could use to adapt their step symmetry: they could shift the center of oscillation (i.e., spatial) of each limb or alter the phasing (i.e., temporal) of motion between the limbs. Figure 6 [in the original report, see PDF]shows the adaptation and deadaptation pattern for the center of oscillation difference. For adaptation, the conscious correction group adapted fastest, the control group was intermediate, and the distraction group was slowest [F(2,30) = 9.16, P < 0.01]. The rates are similar to those calculated for step symmetry during adaptation (Fig. 5C). Post hoc analysis on the rate of adaptation for center of oscillation difference showed that distraction was significantly different from control (P < 0.02) and conscious correction (P < 0.01), while the difference between the control and conscious correction group was not significant (P = 0.09). The same pattern held in deadaptation: the conscious correction group was fastest, followed by the control group and the distraction group (Fig. 5D). ANOVA results in group rates of de[-]adaptation for center of oscillation difference only showed a trend toward significance [F(2,30) = 2.24, P = 0.12]. In sum, our manipulations had a clear effect on spatial elements of limb motions.
“In contrast, there was very little effect on the time course of adapting temporal elements of limb motion. Figure 7 [in the original report, see PDF]shows the average plots of phasing adaptation and deadaptation for each group. All three groups adapted (Fig. 5E) and de[-]adapted (Fig. 5F) hasing at similar rates. ANOVA effects of phasing rate for adaptation [F(2,30) = 0.35, P = 0.71] and deadaptation [F(2,30) = 1.33, P = 0.28] showed no difference in group. Moreover, it is interesting to note that the phasing adaptation rate differs markedly from that observed for step symmetry—it is at least twice as fast as that for spatial parameter rates.” [Formatting and emphases added.]
Next, Malone and Bastian begin their Discussion section with,
“Here we showed that conscious corrections speed up splitbelt walking adaptation, whereas distraction slows it down. Perhaps more surprisingly, deadaptation followed a similar pattern despite removal of the visual feedback or distracter during that period of the experiment. One interpretation of this is that how one learns affects the rate of unlearning (Huang and Shadmehr 2009), possibly because subjects engage neural circuits with different time courses under these conditions. We also found that our manipulations affected the adaptation rate of spatial elements of walking (i.e., stepping distance) but had minimal effects on the adaptation rate of temporal elements of walking (i.e., phasing). This unexpected result suggests that the control of spatial and temporal patterns of walking may be accessible through different neural circuits.”
In their Discussion section on ” Conscious versus automatic control”, they stated,
” Conscious or executive control can to play a role in the very initial stages of reaching adaptation (Taylor and Thoroughman 2008). In this study, we also saw that conscious processes engaged in the conscious correction group affected the initial epoch of adaptation most (i.e., 1st 60 strides). Additionally, we saw a trend that the conscious correction group deadapted more quickly, suggesting that this conscious modulation of walking can be rapidly disengaged. This is most obvious in our measure of purely spatial control of the limbs (i.e., the center of oscillation). In contrast, reducing conscious correction by requiring dual-task performance leads to slower adaptation.”
In the next Discussion section on ” Distinct control of spatial versus temporal patterns of walking” they stated,
” The differences in the adaptation rates of spatial and temporal elements of walking were unexpected—based on our prior work, we had assumed that they were controlled by overlapping neural systems, and would therefore adapt together (Choi and Bastian 2007). Instead, this dissociation shows that conscious correction processes may have preferential access to spatial and not temporal control of the limbs during walking. Evidence from our control group in this study supports this notion: they showed differences in the adaptation rate of temporal versus spatial parameters, with the former adapting nearly 2 times faster (cf. blue bars, Fig. 5, C and E).”
Finally in the section on ” Potential neural substrates” Malone and Bastian state,
“Our observation of differences in spatial versus timing adaptation begs the question of whether different neural structures contribute to these processes. We suggest that it is plausible—for example, at the spinal cord level, a two-level CPG has been proposed where separate neural networks are responsible for rhythm control and pattern generation (Lafreniere- Roula and McCrea 2005; Rybak et al. 2006). This could be a substrate for differential control of timing and spatial features of locomotion. Additionally, tonic stimulation of the mecenscephalic locomotor region can adjust the timing of gait (Shik et al. 1969), while descending drive from vestibular systems in decerebrate cats can change the balance of flexor and extensor muscle activity (Gottschall and Nichols 2007), possibly reflecting a change in the spatial pattern. Lesion data from our laboratory suggest that supraspinal centers are needed for this adaptation in humans. In particular, cerebellar damage impairs adaptation of both timing and spatial features of walking (Morton and Bastian 2006). It is possible is that distinct cerebellar regions preferentially influence different levels of spinal control of locomotion. Cerebellar control of the timing of locomotion could require the spinocerebellum. Indeed, stimulation of Deiter’s nucleus (termination region of fastigiovestibular fibers) has been shown to influence the timing of the locomotor pattern (Russell and Zajac 1979). Descending projections through the vestibulospinal and reticulospinal pathways could influence the rhythm generator in the two-level CPG (Arshavsky et al. 1978a-c). Conversely, control of spatial pattern of locomotion could be adjusted through the lateral hemispheres of the cerebellum, which has projections to cerebral structures via the thalamus. These cortical structures (particularly motor cortex) can influence the pattern generator of the CPG through corticospinal pathways. This organization could explain why only the spatial features of locomotion (i.e., center of oscillation) were influenced by our manipulations. If the spatial pathway was accessible through cerebral centers, it may be more affected by conscious effort toward the task versus cognitive demands away from it. In contrast, if the temporal features were controlled by midbrain/ brain stem structures, they would be more difficult to access with our conscious control or distraction mechanisms.”
Student: Very thorough. Maybe you could copy this into a Review Page and entitle it: “Coordination: Recent Advances”
Professor: Thanks, and it is their writing that really helps me tell their story. And now they have another update. Malone, Bastian, and Torres-Oviedo (2012) just published this article, “How does the motor system correct for errors in time and space during locomotor adaptation?” Next post will look at this.
References
Choi JT, Vining EP, Reisman DS, Bastian AJ. Walking flexibility after hemispherectomy: split-belt treadmill adaptation and feedback control. Brain 132: 722–733, 2009.
Heng C, de Leon RD. The rodent lumbar spinal cord learns to correct errors in hindlimb coordination caused by viscous force perturbations during stepping. J Neurosci 27: 8558–8562, 2007.
Hodgson JA, Roy RR, de Leon R, Dobkin B, Edgerton VR. Can the mammalian lumbar spinal cord learn a motor task? Med Sci Sports Exerc 26: 1491–1497, 1994.
Malone LA, Bastian AJ. Thinking about walking: effects of conscious correction versus distraction on locomotor adaptation. J Neurophysiol 103: 1954–1962, 2010.
Malone LA, Bastian AJ, Torres-Oviedo G. How does the motor system correct for errors in time and space during locomotor adaptation. J Neurophysiol (April 18, 2012). doi:10.1152/jn.00391.2011
Morton SM, Bastian AJ. Cerebellar contributions to locomotor adaptation during split-belt treadmill walking. J Neurosci 26: 9107–9116, 2006.
Musselman KE, Patrick SK, Vasudevan EVL, Bastian AJ, Yang JF. Unique characteristics of motor adaptation during walking in young children. J Neurophysiol 105: 2195–2203, 2011.
Pearson KG. Role of sensory feedback in the control of stance duration in walking cats. Brain Res Rev 57: 222–227, 2008.
Reisman DS, Block HJ, Bastian AJ. Interlimb coordination during locomotion: what can be adapted and stored? J Neurophysiol 94: 2403–2415, 2005.
Reisman DS, Wityk R, Silver K, Bastian AJ. Locomotor adaptation on a split-belt treadmill can improve walking symmetry post-stroke. Brain 130: 1861–1872, 2007.
Rossignol S, Dubuc R, Gossard JP. Dynamic sensorimotor interactions in locomotion. Physiol Rev 86: 89–154, 2006.
Vasudevan EVL, Torres-Oviedo G, Morton SM, Yang JF, Bastian AJ. Younger is not always better: development of locomotor adaptation from childhood to adulthood. J Neurosci 31: 3055–3065, 2011.