Archive for the ‘Endurance-Education.com’ category

Perception of Symptoms and the Regulation of Endurance Performance

June 5th, 2013

Professor: Welcome to this Blog and a look at topics for June 2013 thru September 2013.

Overall, the goal is to get deeply involved with Perception and Regulation of Endurance Performance.

Student: How deep is deeply involved?

Professor: How deep in physiology? Or how deep in psychology?

Student: Proske & Gandevia (2012) are physiologically deep.

Professor: Their excellent in-depth review on Proprioceptive Senses is superb. And they were clear that,

“The subject of proprioception lies at the boundary between

neurophysiology and neuropsychology. In this review we

have taken a more physiological view and restricted ourselves

to a discussion of aspects of the physiology of proprioceptors,

their central projection patterns, and the generated

sensations.”

Professor:  Please notice that last word, “sensations”. In their review, they soon comment that,

“An expanding field concerns the interactions
between proprioception, vision, and vestibular inputs.
While we discuss some of this, we have not reviewed the
area exhaustively. The same applies at the more
psychological
end of the subject, for example,
sensorimotor integration
in the generation
of concepts of “wellness,” emotions, and social interactions.”
[Emphasis added]

Professor: I am guessing that they do not want to discuss “perceptions”.
Click here to read more

Gold Nuggets in Posts from February – May 2013

May 30th, 2013

Student: So you have found a lot of gold nuggets in all these posts.

Professor:. So I’ve grouped these 14 posts in the following:

  1. Basic movement mechanisms
  2. Motor synergies and patterns
  3. Coordinated adaptation to ‘limping’
  4. The sense of effort

In this post I’ll dig into the first three groups and save The Sense of Effort group for the initial post of next trimester.

1.      Basic movement mechanisms

Professor: A hugh gold nugget is from the second post, NOPE; Spinal Interneurons are NOT Activated In A Graded Manner.

This dropping out of interneurons is the nugget found by McLean et al. (2008).

  • The graded recruitment of motoneurons continues to be a universal phenomenon.
  • However, different locomotor speeds involve some shifts in the set of active interneurons.
  • Some interneurons active at slow speeds are silenced at faster ones and this pattern occurs both within and between excitatory classes.
  • Thus, the interneurons behave differently from the motoneurons with respect to recruitment because the motoneurons only add neurons to the active pool as speed increases, while the interneurons add new ones while removing others that were active at slower speeds

Student: The active set of interneurons continuously shifts with changes in speed for the zebra fish and perhaps as a general principle for all vertebrates. Does this happen with fatigue?

Professor: Very intriguing question, and the answer(s) I hope will come in the next set of posts.

Student: “What Is the Primal Movement Starter?” Classy title; how come the term “primal”?

Professor: Consider escaping from the sabertooth tiger as an ancient survival tactic. The Trigger Command Neuron is even found in a primordial creature like the leech.

Click to read more

Halt and Review

May 14th, 2013

Student: How many blog posted this year?

Professor: This is the 14th.

Student: Can you remember the topics for the first couple of posts? Hey, I know you’re retired, and I am not suggesting you getting senile.

Professor: Well, I’m guessing they were about locomotion.

  • Maybe the next post could be a review of these posts.
  • And how often would a review be advisable?
  • Could the years be divided into blocks?

Student: I like looking for blocks of posts. Indicates to me that the website isn’t scattered, just doing random ‘shoot-from-the-hip’ postings.

Professor: Me too. How does publishing on a trimester basis seem to you?

  • Feb 2013 – May 2013
  • Jun 2013 – September 2013
  • October 2013 – January 2014

Student: Superb. And the last month would have catch-up time.

Professor: You’re right in the bulls eye.

Take Home: Next Endurance-Education Blog Trimester will be June 2013 – September 2013.

Next for February – May 2013: Review of the recent Blog Posts with the challenges for next trimester.

The Sense of Effort is … (Part 4: Signals of Efference Copy and Effort)

April 30th, 2013

Student: Figure 11 in Proske & Gandevia (2012) is fixed. I used plurals and changed Motor Command to Motor Commands and Efference Copy to Efference Copy Signals!

Professor: Attaway. Nice quick thinking.

Student: And where do the Efference Copies go?

Professor: Actually, as many as four copies with one coming:

1)    from the spinal cord and going to an oculomotor nucleus,

2)    from the spinal cord and going via the spinocerebellar tract to the cerebellum,

3)    from the frontal cortex, going to the basal ganglia, then on to the cerebellum, and

4)    from the frontal cortex and going via the pontine nuclei to the cerebellum.

Professor: A more important question is, “What is the sensory signals?”
Click here to read more

The Sense of Effort is … (Part 3: Motor Command Networks)

April 23rd, 2013

Student: What a pile of articles! And what did you find on commanding movement?

Professor: It depends upon:

  • What are the types of movements?
  • What is the nature of the network(s) for motor command?

Student: Well, one way of looking at movements is to consider the muscle mass involved:

  • Fine motor movements, like tapping on a button, or
  • Gross motor movements, like doing deep knee bends.

Professor: Then another view of movement is how much learning is involved:

  • None, or
  • Over-learned involving:
    • Maintenance actions, like running smoothly at an easy pace,
    • Reflexive actions, like walking over tilted stones on a pathway, or
    • Voluntary actions, like switching to a different trail when running in the woods.

Professor: Now, what kind of motor command is involved with each?

Student: Interesting! Is this a trick question?

I thought that the only motor command is from Betz cells sending discharges down the corticospinal pathway.

Professor: Motor imagery (MI) studies have examined the role of the corticospinal pathway during imagined and actual movements. In a very comprehensive review, Guillot et al. (2012) found that:

“The contribution of the contralateral primary motor cortex (cM1) to imagined actions is […] controversial.”

Click here to read more

The Sense of Effort is … (Part 2: A Mismatch!?)

April 19th, 2013

Student: Proske and Gandevia in 2012 described an exafferent component as the “afferent signals generated by stimuli of an external origin”.

Professor: Well said; almost an exact quote.

Student: For me, running is mostly automatic, overlearned, rhythmic movement. How come I have no Sense of Effort during long periods of slow, easy running?

Professor: The simple answer is there is NO mismatch according to the theory cited byProske & Gandevia.

  • That is, no error exists between the efference copy and the signal from motor command at the ” ‘difference’  calculator “.
  • Proske & Gandevia further down the legend state, “if the predicted and actual sensory feedback match, the anomalous situation arises where there is no perception at all”.

Student: They even wrote that this instance is an ‘anomalous’ situation! So,

  • Are they referring to voluntary contractions, perhaps using fine motor control or learning a gross motor pattern?
  • Then again, there are well over-learned, automatic movements like running! Is jogging through the forest in Germany, only noticing the holes dug out by WWII bombs, just an ‘anomalous’ situation?!

Professor: Very interesting and intriguing questions. Then the answer is a sense of effort is to have A Mismatch!

Student: And what is the “motor command”?

  • What if during some or many walking or running or cycling strides, no motor command signal was ‘issued‘?
  • Or is there always a command signal coming down the efferent nerves to the active motor pool?

Professor: Let’s do some digging into the History of Motor Command and Control of Muscle Recruitment. Maybe we can find the answers to those questions, or at least get the ‘dogma’ scientists state about command signals.

Reference

Proske U, Gandevia SC. (2012) The proprioceptive senses: their roles in signaling body shape, body position and movement, and muscle force. Physiol Rev 92: 1651–1697.


The Sense of Effort is … (Part 1: The exafferent component?!)

April 10th, 2013

Student: Your post for October 15th, 2012 had the title, “What is meant by Effort or Exertion?” Have you gotten any clues?

Professor: Well, as a matter of fact I reread that Post, and I found a review article by Prostke and Gandevia (2012) that have provided some much needed insight.

Here is some of what I wrote back in 2012:

“… While jogging on the level at a slow pace for me, I was doing more thoughts about “Where is the next patch of thick grass for my sore feet?”  than “Push on each stride.” “What is my Rating of Perceived Exertion” was not anywhere in my self-talk. Coming to an upslope, however, to maintain my pace, at first I did have to focus a bit on “Push a little more with each stride”. Then once I noticed I was pushing “hard enough”, my self-talk shifted to focus upon running relaxed, and I comfortably crossed over the little hill.” [Emphases added]

Professor: Notice that effort for me was not conscious until I had to focus on my running. My research on effort had biased my ‘noticing’ to look for only a “motor command”.

Part way through their very informative review for an old-timer like me they wrote a subsection on “the Sense of Effort” which went like this:

Click to read more

How does the Motor System correct walking errors?

April 2nd, 2013

Student: Wow, was I ever slipping and sliding, just trying to walk outside. It was a street with patches of ice: step, step, slide, step, sliiiide, ….

Professor: My walking was off today, too. I was limping from sore knee like walking in a wooden leg: step, thump, step, thump, ….

Student: I noticed I was got ‘off balance’ but without thinking I never fell down.

Professor: Hmm. We could be correcting for perceived differences, i.e., errors, like from where we were supposed to be walking to actually where we were walking.

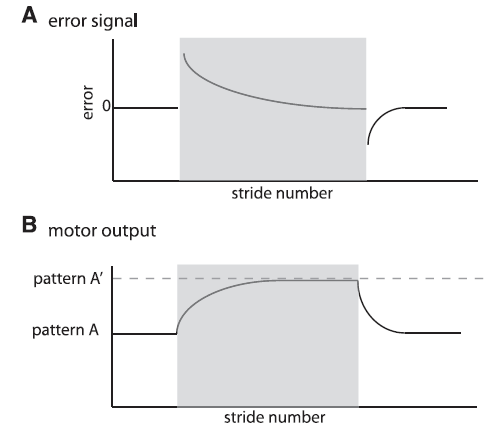
Malone, Bastian, & Torres-Oviendo (2012) recently studied walking errors in detail. Below is their Figure 1 that illustrates how this errors signal may happen and could be used to make a smooth adaptive transition from a sudden change, i.e., perturbation, while walking:

Malone etal 2012 Fig 1

Fig. 1. Schematic of error signal and motor output. Shaded region represents the adaptation period. A: Parameters quantifying error are perturbed early in adaptation and decrease throughout adaptation. They also show the opposite perturbation in deadaptation. B: Motor outputs exhibit a smooth change from a set pattern A to a new value during adaptation (pattern A’), set by the environmental conditions. They also must be actively deadapted with a smooth transient from pattern A’ to pattern A when environmental conditions change back to the original state. [Emphases added.]

Student: How can we measure the error between what is expected and what is actual for walking?

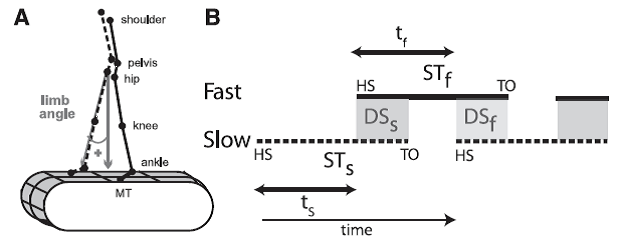
Professor: What did Malone and her co-investigators utilize for measuring walking? They used gait parameters as shown below in their Figure 2:

Malone etal 2012 Fig 2

Fig. 2. Definitions of parameters. A: Marker diagram for experiments 1 and 2 with limb angle convention shown. MT, 5th metatarsal head. By convention, positive limb angles represent when the ankle is in front of the hip (flexion) and negative angles when it is behind (extension). B: Schematic defining temporal parameters of locomotion during normal, symmetric walking. Time is represented along the horizontal axis, with time increasing from left to right. HS, time at heel-strike; TO, time at toe-off. Solid and dashed lines represent stance time periods (ST) for the slow (STs) and fast (STf) legs, respectively. White areas between these lines represent swing time periods (i.e., time intervals from TO to HS). Shaded areas indicate when both feet are on the ground, defined as double support periods (i.e., overlap in stance time for both legs); DSs and DSf are slow and fast double support periods, respectively. Slow and fast step timings (ts and tf) are defined as the time between consecutive heel-strikes. [Emphases added.]

Professor: The legend for their Fig. 2 shows these important parameters. The Stance Time for the ‘slow’ leg (STs) is from Heal Strike (HS) to Toe Off (TO) of the slow limb; vice versa for the ‘fast’ leg Stance Time (STf). Double Support for the slow leg (DSs) begins at heel strike for the fast leg and lasts until toe-off for slow limb; vice versa for the fast leg. During Stride Time for the slow leg, its Step Time (ts) lasts to the beginning of Double Support; vice versa for the fast leg (tf). Stride Time (Tstride) for either leg was the difference in time from heel strike to the subsequent heel strike.
Click to read more

Control of Leg Timing vs Placement during Split-Belt Walking

March 26th, 2013

Student: Ough, I hurt my left knee running this week. And it’s hard not to be limping. It’s sorta like walking on a split-belt treadmill!

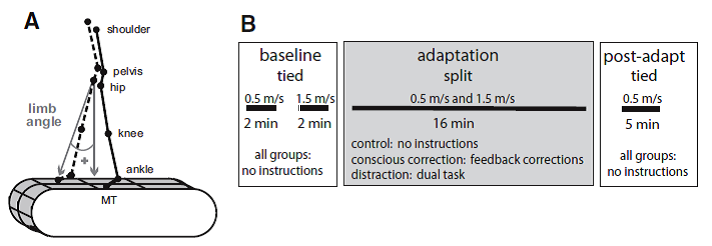
Professor: Well, another recent  study from Bastian and colleagues gives us more information on limping. Specifically, Malone and Bastian (2010) studied the effects of “conscious correction versus distraction” upon ‘limping’ during adaptation to split-belt walking. Below is their Fig. 1 showing their methods:

Malone Bastian 2010 Fig 1

FIG. 1. A: diagram of marker location and limb angle convention. B: experimental paradigm showing the periods of split-belt walking and conditions.

Professor: The methods of previous post (Perturbing Infants Locomotor Patterns With A Split Belt Treadmill) from a study of infants by Musselman, Patrick, Vasudevan, Bastian, and Yang (2011) are very similar to this study by Malone and Bastian. However, Malone and Bastian studied adults, and the experiment had two baseline periods each at the different speeds, a fixed adaptation period, and a fixed de-adaptation period. Notice: Malone and Bastian used as 3:1 fast:slow split-belt ratio instead of the 2:1 ratio Musselman et al utilized. Malone and Bastian also studied three groups of subjects each having different instructions. Their detailed description of the groups state that,

  1. “Subjects in the control group were given no instructions (n = 11).
  2. “The conscious correction group was given on-line visual feedback of their steps and instructed to “keep their step lengths equal on both sides” during the entire adaptation block (n = 11). To allow subjects to develop their own error monitoring and correction mechanisms, the experimenter demonstrated what was defined as a step length until the subject had an understanding of the parameter, but allowed the subject to monitor his/her own errors (i.e., the experimenter did not comment on the step lengths) once the experiment began.
  3. “The distraction group (n = 11) watched a television program unrelated to walking and were told to count the number of times a particular word was said using a handheld counter. Additionally, subjects in the distraction group were asked to focus their attention on the television so that they could answer questions about the program’s visual scenes after the adaptation block finished. Therefore the subjects were distracted by audio and visual stimuli.” [Numbering and emphases added.]

Click here to read more

Perturbing Infant’s Locomotor Patterns with a Split-Belt Treadmill

March 21st, 2013

Student: How young can a child be…. Well, how well coordinated can a child be so it can adapt to walking on a split-belt treadmill? Ahh, with a minimum of assistance?

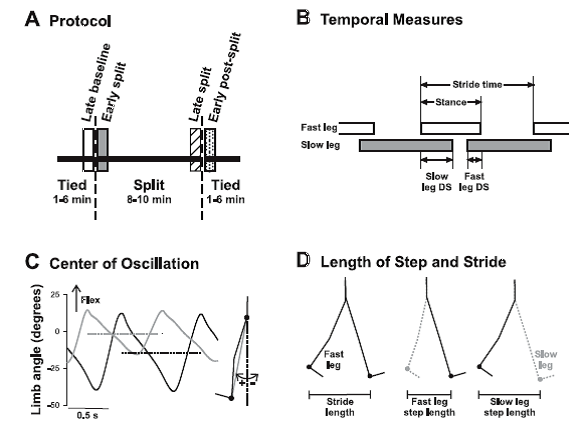
Professor: Musselman et al. (2011) determined that children, older than 8.5 months, were the successful participant in thein study. Below is their Fig. 1 showing and describing their methods:

Musselman etal Fig 1 2011

Fig. 1. Methods. A: experimental protocol. Children walked on a split-belt treadmill with the belts at the same speed (tied), followed by the belts at different speeds (split), and finally again in the tied condition. Time periods of interest are late baseline (open bar), early split (shaded bar), late split (hatched bar), and early postsplit (stippled bar) at 40 steps for each period. B: temporal measures of walking are shown: stride time, stance time, and double support time. Open and shaded horizontal bars indicate the duration of the stance phase, and the space between the bars represents the duration of the swing phase. The duration of a stride includes a stance and a swing phase. Temporal coordination was quantified by double support times (i.e., time when both feet are in contact with the ground), shown for when the slow leg is trailing (slow DS) and when the fast leg is trailing (fast DS). C: center of oscillation is the mean limb angle over a stride. Limb angles of the fast (solid line) and slow (shaded line) legs are plotted for 1 child (35.2 mo) during early split. Dashed horizontal solid and shaded lines represent the mean limb angles for the fast and slow legs, respectively. Limb angle is the angle between the vertical and a vector connecting the hip and ankle markers (shaded line in inset at right). D: step length and stride length are illustrated. Step length, defined as the distance between the ankle markers of the 2 legs in the anteroposterior direction, was measured at the time of foot contact of the leading limb (i.e., instant in time illustrated at middle and right). The step lengths are named according to the leading leg, by convention. Stride length (left) is the distance traveled in the anteroposterior direction by the ankle marker of a single leg through the stance phase (i.e., foot contact to lift off, limb position shown for the 2 instances in time). [Emphases added.]

Right-click this link to download PDF of their study

Click link to read more.

Does Our Brainstem select Our Motor Programs?

March 11th, 2013

Eh! What? Motor programs operated by the brainstem?

Okay, my brainstem is the extension of my spinal cord. And I’m guessing this means just my brainstem selects each motor program I use?

Well, the short answer is Yes and No. Let’s  allow the experts to explain!

First, in their paper entitled, ” Is there a brainstem substrate for action selection?”, Humphries et al. (2007) observe,

” Decerebrate animals and altricial (helpless at birth) neonates do not have fully intact basal ganglia but are capable of expressing spontaneous behaviours and coordinated and appropriate responses to stimuli. … Yet, the chronic decerebrate rat can, for example, spontaneously locomote, orient correctly to sounds, groom, perform coordinated feeding actions and discriminate food types …. Such animals clearly have some form of intact system for simple action selection that enables them to both respond to stimuli with appropriate actions (more complex than simple spinal-level reflexes), and sequence behaviours—as demonstrated by the holding, gnawing and chewing required for eating solid food.”

Please click this link to read more

What Happens When I Switch from Walking to Running?

March 5th, 2013

Before I was retired, I used to take the bus to work.

  • One day, when I am walking toward the bus stop, I saw my bus already pulling up to my bus stop, and I noticed, in a moment later, that I was off and running toward it.
  • Later on, I realized in that brief moment, I had made an abrupt and radical switch from walking to running.

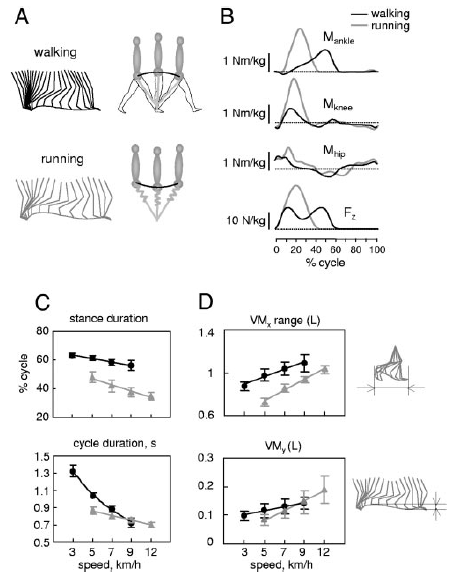
Well what happened? To answer that question, let’s allow Lacquaniti’s group provide the answer from their utterly fascinating study on walking versus running (Cappellini et al 2006). They describe the general characteristics of walking and running in their Fig. 1 shown below (notice that walking is solid black lines and running is fainter grey lines):

Ivanenko etal 2006 Fig 1


FIG. 1. General characteristics of walking and running. A: schematic representation of walking by vaulting (inverted pendulum) and running by a “bouncing” gait (leg spring-loaded behavior during stance). B: ankle, knee, and hip moments of force and vertical ground reaction force (normalized to the subject’s weight) of the right leg during overground walking (5.4 km/h) and running (9.4 km/h) in 1 representative subject. C: relative stance duration and cycle duration (± SD) in walking and running. D: foot (fifth metatarsophalangeal joint, VM) trajectory characteristics (mean ± SD, normalized to the limb length L): horizontal excursion of the VM marker [relative to greater trochanter (GT)] and vertical VM displacements (in the laboratory reference frame).

Click here to keep reading this post.

Role of Primitives, Patterns, Weights, and Modules during Locomotor Development

February 26th, 2013

Primitives. Hey! What do you mean by “Primitives”?!

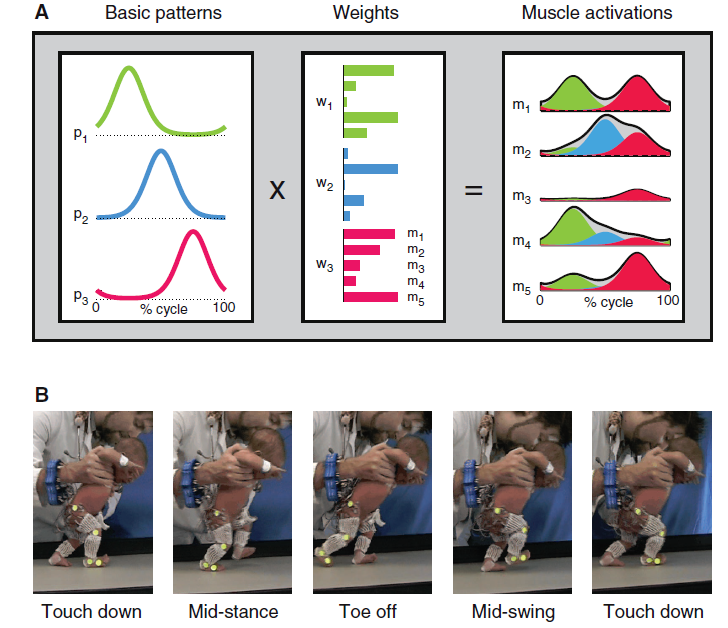
According to Giszter et al. (2010), the “term ‘primitive’ may best indicate the idea of a set of building blocks or developmental bootstrap elements that is used in a constructive or compositional fashion” from which “larger modules can be made.”

Thus, these primitive building blocks can be hypothesized to define modules of muscle activations that are a combination of basic patterns and weights distributed to the muscles composing the module (see Lacquaniti et al. 2012).

Dominici etal 2012 F1

Fig. 1. (A) Schematic of motor modules (m). Simulated example of muscle activity profiles as weighted (w) sum of basic patterns (p): mi(t)=Σjpj(t)wij. The outputs of the first (green), second (blue), and third (magenta) modules are summed together (i = 5, j =3) to generate overall muscle activation (black envelope). (B) Illustration of a step cycle in a 3-day-old newborn.

Click to keep reading this post!

NOPE; Spinal Interneurons are NOT Active In A Graded Manner

February 19th, 2013

Are the motoneurons like those involved in swimming, for example, by a zebra fish, recruited in a graded manner? Yup

Then, are the active set of spinal interneurons graded during increases in swimming speed? NOPE!!!!

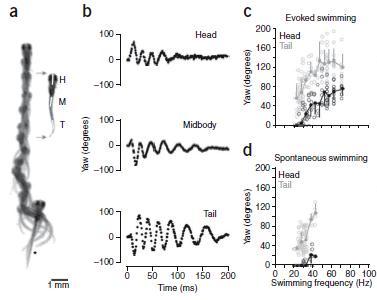
A fascinating study by Fetcho, McLean, and colleagues (2008), entitled “Continuous Shifts in the Active Set of Spinal Interneurons during Changes in Locomotor Speed” found these finding in the larval zebra fish. Instead of repeating what they wrote, here are some intriguing figures:

Figure 1, Parts a – d. Gradation of movement. These parts of Figure 1 show slow swimming in a; movement around vertical axis (i.e., yaw) for head, midbody, and tail in b; yaw for evoked swimming in c; and yaw for spontaneous swimming in d. Parts c and d demonstrate that “fish can smoothly grade between the fastest and the slowest swimming movements without any obvious discontinuity in the axial bending pattern.”

McLean etal Cont shifts 2008 Fig 1 top1

Figure 1 a-d.  Analysis of real and fictive evoked swimming movements. (a) Consecutive overlapping images of a bout of swimming elicited by a tactile stimulus to the tail (at asterisk). A frame extracted from the montage (gray arrows) shows the regions selected for kinematic analysis at the head (H), midbody (M) and tail (T). Images were captured at 1,000 Hz (images 1–9, every 4 ms; 10–12, 8 ms; 13–14, 16 ms; 15–18, 32 ms). (b) Automated analysis of yaw at three points along the body, from the bout in a. Only the tail showed any noticeable movement at the end of the bout, when swimming was slowest. (c) Plots of head and tail yaw from 12 evoked swimming bouts in 12 larvae. The degree of head and tail yaw decreased as a function of swimming frequency. Open circles are raw data points, whereas closed circles represent means (± s.d.) from data binned at 5-Hz intervals (for example, 15–20, 20–25, etc.). (d) A similar plot for spontaneous bouts of swimming (12 from the same 12 larvae), whose values are comparable to the lower end of evoked swimming frequencies. Only the first episode of the five analyzed in each fish is shown in c and d.

 
Keep reading this poat.

What Is the Primal Movement Starter?

February 12th, 2013

ooh! OOH! ESCAPE!

There is no doubt that escaping capture was critical to survival.

So, what starts escape and also other forms of movement? Let’s start by looking at a primitive animal: the leech.

Escape for the leech is swimming, as long as it is in relatively deep water. A tap on its tail will result in fast swimming!

How does a leech swim? It creates an approximately sinusoidal, undulatory traveling wave. Contraction and relaxation of dorsal and ventral longitudinal muscles are primarily responsible for swimming undulations (Lamb & Calabrese, 2011).

NOTE: for scientists, there is neural activity ‘sign’ that an isolated or nearly isolated leech preparations would be swimming if it was in an intact leech. The ‘sign’ is a bursting pattern of a dorsal excitatory motoneuron in these preparations, and the behavior is called “fictive” swimming. Researchers frequently refer to “fictive swimming” as a “swim”, “swim episode”, “swimming”, and “swim activity” (Mullins et al. 2011a).

What are the pathways activated in these muscles? At the base is a central pattern generator (CPG) circuit that is composed of complex segmental oscillators which rely heavily on intersegmental connectivity (Lamb & Calabrese, 2011).

Midbody ganglia contain a bilateral, triphasic oscillator CPG circuit composed predominately of bilaterally paired interneurons. And the output from these oscillator interneurons controls the activity of the excitatory and inhibitory motoneurons. It is these interneurons that provide the final common pathway to the longitudinal muscles used for swimming. Otherwise, a leech is simply resting.
Keep reading this poat.

Beginning Objectives for 2013

February 6th, 2013

Here is what is planned for this website for the beginning of 2013:

First, this is the list of next blog Posts:

  1. What is/are the Primal locomotor initiator(s)? And where is it/are they located?
  2. Does the recruitment of spinal interneurons increase according to the motorneuron cell size principle?
  3. How are the recruitment of muscle patterns, i.e., muscle synergies, involved for postural changes during locomotion? Is the midbrain reticular formation or basal ganglia directing any change in motor pattern selection?
  4. What senses muscle force exerted during locomotion? What senses pain? What senses exertion especially during high intensity sport?
  5. How does the estimation of the sense of force, pain, exertion, and effort become reported?  And how is exertion sense used in producing a specific work rate?
  6. What increases the rating of perceived exertion (RPE) during a constant work rate? Is the mechanism related to the Central Governor Model?

Second, the increase in RPE(Delta RPE) will be explored as a Critical Limiting Factor for prolonged endurance. That is, is Delta RPE a Critical Limiting Factor? Or, what are associated with Delta RPE that are Critical Limiting Factors? Also, this means an updating of the background Pages about Limiting Mechanisms, and in the process of updating, perhaps writing a Review Page about Delta RPE and Critical Limiting Factors.

Third, preparations will be made for the next series of blog Posts exploring the mechanisms for pain and fatigue.

Fourth and last, steps will be taken for improving the sharing of this website’s Pages and Posts.

Bending the Mind or Minding the Bend?

December 18th, 2012

A familiar voice said, “Today’s workout is 10 quarters at 62 [seconds]; jog a half lap [in between].”

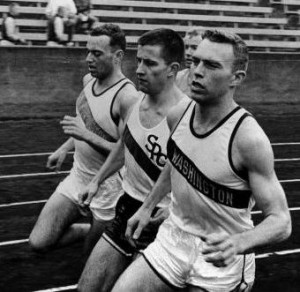
Rounding the last bend of a Mile Race

Rounding the last bend of a mile race

So onto the black cinder track at the U of Washington, we went. Off on the first interval I ran smoothly straight at the first curve, just before got ready, and then felt the lurch to the left, leaning into the curve, and pushing a bit harder to stay up with the others. We glided through the curve, just before the back straightaway got ready, and then felt becoming relaxed, so to speak, to run smoothly straight toward the next and last curve.

Now that I think about last week’s post, ” When you run fast, your brain works harder,” I am still struck with the finding that when leg power in increased, so is hippocampal gamma oscillation power. So what is driving the hippocampus? Ahmed and Mehta surmise it is maybe visual and vestibulatory output. And what happens when you run or even walk around a curve?

Keep reading this poat.

When you run fast, your brain works harder

December 4th, 2012

For me, running these days, is a form of meditation. Essentially, I am running on automatic. To run faster, I have to think, “Run harder.”

How do we actually run harder? What kind of a neural network helps to run faster?

This post is largely borrowed from a Scientific American blog written by Scicurious and published on July 16, 2012: When you run fast, your brain runs faster. This is most of what she wrote:


“… Today  we’re going to talk about a paper that may have worked out a tiny piece of how the brain might deal with things like increased speed. How does your brain keep up with your feet?

By running a little faster.
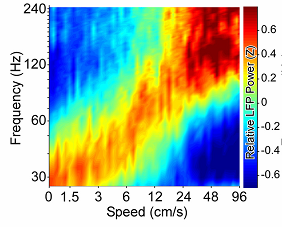


[Above is Figure 2E in Ahmed and Mehta (2012). It is a spectrogram showing the relative local field potential (LFP) at each frequency as a function of both speed and frequency.]

To understand how this works. We need to talk about two major things: place neurons, and oscillatory networks.

Place neurons are just what they sound like. In the hippocampus, certain cells will fire in response to certain places. When you record cell firing from a rat’s brain with an electrode array, you can actually see and hear the neurons firing as a rat looks around a place it has been before (and this is definitely one of the awesome and defining moments of a young neuroscientist), certain neurons will fire for, say, the left corner, and others will fire for the bottom right.

But here’s where we get to oscillation. You see, a neuron doesn’t fire alone. It fires repetitively with large numbers of nearby neurons, in turn triggering other neurons to fire, resulting in a firing network of neurons. These networks fire at certain frequencies and patterns, which we describe by their frequencies, with names like theta and gamma and beta.

The question is, how do things like place cell firing and neural oscillations vary as you move? The authors of this study wanted to see just how place cell firing varied as a function of an animal’s speed. To do this, they hooked electrode arrays into the hippocampi of rats, and watched the oscillations of their place cells as they ran a maze. They set up a nice large Y Maze, with rewards at all the ends, and let the animals run it as fast as they wanted. They looked to see how the activity in the hippocampus varied as a function of speed.
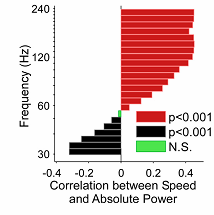


[Above is Figure 4G in Ahmed and Mehta. Ahmed and Mehta (2012). It is a spectrogram showing the relative local field potential (LFP)at each frequency as a function of both speed and frequency.]

What you can see here is a correlation between the power of the gamma oscillations of the place neurons, and the speed of the animals as they ran the maze. It’s not an increase in the frequency of the oscillation, because that would just move it up the [frequency] scale, and it would no longer be a gamma oscillation. Rather, it is an increase in power, more neurons firing in synchrony. They found that as speed increased, there was a strong correlation for the gamma oscillation to increase in power as well. …”

“But what does this mean? What is causing the increase in the gamma oscillations? Well, increased power of gamma oscillations has to be triggered by something. In this case, the authors hypothesized that excitatory input on to interneurons in the hippocampus, which provide inhibitory input to the place cells, might be determining the increase power. When they recorded from interneurons as well as place cells, the authors found that the interneuron firing rate correlated with the increase in gamma power. This suggests that the increased excitatory input stimulated interneurons to increase inhibitory input as the rat runs faster, which might increase synchronicity and might be driving the increased power in the gamma oscillations …”

“But what is the purpose of this increase in gamma oscillations? Since these are taking place in the hippocampus, they may well have something to do with learning and memory. As I mentioned above, neurons in the hippocampus encode things like place, they fire in response to where you are in an area. When they fire synchronously, they do so in the gamma range, resulting in these gamma oscillation. …”

“And this is an important thing to think about. Because, if you’re running FASTER, you have to determine where you are [FASTER] as well! This means that you’ll need to process your spatial information faster. How do you do that? Well, the authors propose two options. First, you could leave out bits of spatial recognition processing, skipping certain elements so you only get the most essential information. But you could also just…run the whole spatial processing sequence faster. And the authors hypothesize that this second option may be the right one. The increased gamma oscillations that correlate with speed are how the animal keeps up with its own feet, processing spatial knowledge faster as it runs faster. The faster transitions might allow the hippocampal cells to encode place no matter how fast you’re going.

But of course, this isn’t the end of the line. This paper shows that increased excitatory input to hippocampal interneurons increases the gamma oscillations, and this varies in speed as you run….but where [do the authors suggest is this] excitatory input itself coming from? From the visual system? The vestibular system? Both? While this provides a cool and interesting piece of the puzzle, there’s always still another step in knowing how we walk and run. And it’s puzzles like that that stop a neuroscientist in their tracks.”

And exercise psychophysiologists, too! Very intriguing that more leg muscle cell power used is associated with more hippocampal place cell power.

Tune back in next week when the topic is Minding the Bend.

Reference

Ahmed OJ, & Mehta MR (2012). Running speed alters the frequency of hippocampal gamma oscillations. The Journal of neuroscience : the official journal of the Society for Neuroscience, 32 (21), 7373-83 PMID: 22623683

About the Scientific American Post Author: Scicurious is a PhD in Physiology, and is currently a postdoc in biomedical research. She loves the brain. And so should you. Follow on Twitter @Scicurious.
Slow and Fast Marathon Runners are the Same

November 26th, 2012

These runners are the Same at what. When taking steps, or running strides, they are the same. How come? By counting their steps!

Yup! In early February 1972, John ‘Jack’ Falkner, PhD, and I were counting steps at the Las Vegas Marathon. We like many others have found this to be the ‘facts.’

Jack was Keynote Speaker at the First Annual Meeting of the RMC, ACSM. I happened to be one of the three co-founders of this Regional Chapter. We chose to have the meeting on the two days before the Las Vegas Marathon.

More importantly, after the meeting, many of us gathered near the finish line with the spectators.

Jack said something like, “I wonder what we could learn from this marathon!?” After hemming and hawing, we decided to investigate stride length as a function of race speed.

METHOD: We noticed a series of telephones poles on the road across from us that the participants took just before they made a right turn and came straight at us for about 200 meters to the finish line. A pair of poles were selected that were the third and fourth from the turn.

Which of the marathoners should we pick? Our sample were 10 of the leaders, 10 at the beginning of the main pack, 10 near the end of the main pack, and 10 who were jogging to the finish near the last of the participants. Our null hypothesis was that the faster runners would have a faster stride frequency than the middle and end runners.

Data collection chores were split by having Jack get the time the runner took from the third to fourth pole and by having me counts the steps run between the poles.  Doing the calculations seemed  complicated until after the race. Jack and I went to the telephone poles and paced off the distance between them, something like 80 feet. First we divided number of steps by number of seconds, then multiplied by 60 s/min, giving steps per minute.

RESULTS: And all four group had about the SAME value of 182 steps per minute (STP). In each of the groups there were persons with faster and slower STP values; there was overlap.

Very, very interesting! Of course, each of the faster groups averaged longer strides.

CONCLUSION: Overall, with similar STP, a runner with longer running strides had increased leg power per stride, and this runner had faster speed.

NEXT WEEK: Is there a relationship between running speed and brain power?

Perceived Effort: along a hallway vs. up a stairway

November 20th, 2012

One day last week, I put Perceived Effort to another test.

As I walked along a hallway, and since I am “an anticipation machine,” (Freyd, 1987, cited by Siegel, 1999), I noticed a stairway at its end. Aha. What if I just kept up this momentum and start up the stairs two steps at a time. “But I might fall on my nose,” I thought. “So I will not change my speed.”

Sure enough, as my right leg made the first double-step, I noticed that I was falling. Well, I also noticed my body sagging as I stepped. And then I felt a definite shift, as my body went to the left leg for the second double-step. Without thinking I pushed harder and arched my back to sorta leap over those next two steps. And a seemingly unconscious leap also happened for the third double-step using my right leg again.  This time I did not arch my back. Whoa! What happened? How did this just happen!?

My body seemed to ignore my request to “keep on keeping on”. It leaped. It was not into teleoanticipation; it did a face saving maneuver. How? (Rather than “How come?” or “Why?”)

Let me hazard a guess: if it was not seemingly conscious, then it was done subconsciously. Okay, then how? Perhaps “not falling on my face” mainly by using vestibulomotor and leg motor reflexes as like a musical score. Maybe the musical managing council was the subcortical locomotor control network comprised of the basal ganglia, the medullary and subthalamic locomotor regions, and the cerebellar locomotor regions. And the musical section leaders were the thoracic and lumbar locomotor regions making sure my arms were coordinated with my legs. Finally, my leg muscles compensated for the muscles in my overly bent right leg via were mediated by musical players in the hemi-spinal  central pattern generators and their contralateral interneurons. Wow, what a modern neurobiological summary gifted by the works of Grillner et al. (2008) and la Fougère et al. (2010).

And where is the word: “Effort”? Well, it is hidden in the phrase, “change my speed”.

So, how do I know how fast I am going?

Please tune in next week…..

References:

Freyd JJ (1987) Dynamic mental representations. Psychological Reviews 94: 427-438.

Grillner S, Wallén P, Saitoh K, Kozlov A, Robertson B (2008)Neural bases of goal-directed locomotion in vertebrates—An overview. Brain Research Reviews 57: 2-12l.

la Fougère C, Zwergal A, Rominger A, Förster F, Fesl G, Dieterich M, Brandt T, Strupp M, Bartenstein P, Jahn K (2010) Real versus imagined locomotion: A [18F]-FDG PET-fMRI comparison, NeuroImage 50: 1589-1598.

Siegel DJ (1999) “The Developing Mind” New York: Guilford Press. p 30.